The target detection and tracking technology of the unmanned aerial vehicle (UAV) is an important research direction in the field of UAV aerial photography. In order to effectively and accurately detect vehicles in a UAV platform and in complicated road environments, the authors proposed a vehicle detection method based on saliency region detection. First, the saliency map of the target is calculated by using the salient region detection method based on the optimized frequency-turned. Next, segmentation methods based on Boolean Map and OTSU are combined to determine the region of interest of the vehicle target in the saliency map image. Finally, a series of vehicle apparent features-based methods based on geometry, symmetry, and horizontal edge wave are used to determine the vehicle and eliminate the interference of roadside objects accurately. Experimental tests carried out from different datasets show excellent performance in multi-vehicle detection in terms of accuracy in complex traffic situations and under different scales and angles of aerial images, realizing fast vehicle detection on the UAV platform.
Wenhui Li. Vehicle Detection on Unmanned Aerial Vehicle Images based on Saliency Region Detection. [J], 2019, 15(2): 688-699 doi:10.23940/ijpe.19.02.p33.688699
1. Introduction
The Unmanned Aerial Vehicle (UAV) is an aircraft that has capability of being remotely piloted, autonomous, semi-autonomous, or fully automatic flying. UAVs are mainly divided into fixed-wing UAVs, helicopters, and multi-rotor UAVs. Prior to 2010, fixed-wing drones and unmanned helicopters dominated the aerial photography field. However, in recent years, with the rapid development of control technology, sensor technology, and computer vision, multi-rotor UAVs have become increasingly popular in the field of aerial photography.
Target detection and tracking technology is a key technology in the field of computer vision, and it has attracted the attention of scholars. In the fields of drone aerial photography, target detection and tracking are indispensable for tracking shooting[1]. Therefore, target detection and tracking technology is an important research direction in the field of UAV aerial photography. In addition, the target in the aerial video is small and the background is complex. Target detection is easily affected by interferences of scale changing, rotation, light variation, occlusion, and camera shaking, which makes the detection and tracking of targets in aerial video more difficult.
The accuracy of the target detection will directly affect the subsequent processing of the target location. Therefore, the target detection technology plays a crucial role in the target detection and tracking system based on the UAV aerial video. At present, the moving object detection algorithm is relatively mature, and the target detection algorithms that can be applied to drone aerial video mainly include the following categories:
(1) Target detection method based on frame difference[2-4]. The moving target is determined mainly by grayscale value difference between pixels in the same position of two successive frames. [2] applied a background subtraction method based on median to detect vehicles. [3]applied a frame difference method, combining with the image registration process to detect moving vehicles. The frame difference-based algorithm is simple to operate and easy to implement; however, this algorithm is only suitable for the target detection in static background. In other words, it is only applicable to the detection of moving targets in the hovering state of a UAV, and the application range is limited.
(2) Target detection method based on optical flow[5]. The optical flow-based method uses the optical flow as the instantaneous field of grayscale pixel in the image to achieve the target detection. The optical flow-based method is mainly divided into four categories according to the principle: a gradient-based method, a matching-based method, an energy-based method, and a phase-based method. However, optical flow methods are sensitive to background motions.
(3) Target detection method based on feature matching. The target template is established by extracting the features of the target to be detected (corner features, colour features, etc.), and then the similarity of the target template in the real-time video is extracted to detect the target. At present, the most commonly used feature matching algorithms are SIFT [6], SURF[7], BRISK [8], and FREAK [9]. Feature matching is the most widely used target detection and recognition algorithm, and the feature matching algorithm is suitable for both the target detection of dynamic background and the detection of static targets [10].
(4) Target detection algorithms based on machine learning. In recent years, object detection algorithms, such as bLPS-HOG+SVM[11], V-J+SVM[12], HOG+SVM[13], Disparity Maps + HOG based detector[14], discriminatively trained deformable part model(DPM)[15], and V-J object detection scheme[16],have become popular for vehicle detection in UAV videos. Object detection algorithms are less sensitive to image noise, background motions, and scene complexity.Therefore,they are more robust[17]. However, due to the computational complexity, the machine learning-based method is slow in detecting multiple objects and therefore cannot satisfy the requirement of real-time applications.
In summary, this research aims to propose a method that can detect vehicles from UAV videos quickly and accurately. The rest of our work is organized as follows: a fast vehicle ROI detection algorithm based on modified frequency-tuned saliency region detection is proposed in Section 2. Section 3 briefly introduces a target region of interest segmentation method in our work. Then, a vehicle verification algorithm based on horizontal edge wave is further presented in Section 4. Section 5 shows a comprehensive evaluation of the proposed method using different scenarios. Section 6 finally concludes this paper.
2. Fast Vehicle ROI Detection Algorithm based on Modified Frequency-Tuned Saliency Region Detection
Through the analysis of the test videos and vehicle samples under a large number of UAV aerial images, we found that vehicles have significant visual salient features with respect to the road surface and most of the background area. In addition, the results of our previous work[18] show that the pixel grayscale values in the shadow area at the bottom of the vehicle basically all fall within the first 5% of the grayscale histogram of entire image. However, only the vehicle bottom shadow region can be detected by using the shadow detection method. Using the visual saliency detection method can not only detect the vehicle region, but also detect the shadow region under the vehicle in the image; this can increase the probability of extracting the vehicle region of interest[19]. Therefore, we first use the visual saliency detection method to determine the region of interest of the vehicle in the aerial image. At present, the target detection method based on saliency detection is a research hotspot in the field of target detection.
In recent years, a large number of saliency detection methods have emerged. Figure 1 illustrates comparison results between state-of-the-art saliency detection algorithms that are processed on the data set in the experiment section of this paper: (a) is the original image, (b) is the grayscale image of (a), (c) is the ground truth, (d-n) are the respective saliency map results of AC [20], RC [21], HC [22], LC [23], IM [24], SUN and SUN-CON [25], IT [26], SaliencyMap [27], and FT-LAB and FT-L [28], which are processed on Frame #70 of testvideo1 (video resolution: 960×540) in our data set. Experimental results show that the AC, RC, LC, HC, and IT methods can quickly detect the target region in the image. However, as can be seen from Figure 1 (d), (e), (f), and (g), except for the target, the saliency eigenvalues are relatively close to a large number of interference regions; therefore, the subsequent segmentation algorithm will split out more interference regions. It can be seen from Figure 1 (h), (i), and (j) that the detection results of IM, SUN, and SUN-CON are quite satisfactory; however, the processing times of these three algorithms all exceed 2900ms. The algorithm has high complexity and cannot be applied to real-time detection system. The principle of the Saliency Map and FT-LAB are roughly the same; however, since FT-LAB performs Gaussian smoothing on the L, A, and B components of the LAB color space of the image, the complexity of the algorithm is relatively high. If the FT-LAB is reduced and only the L channel is processed, the processing result of the algorithm is shown in Figure 1 (a). It is almost the same as FT-LAB, and the processing speed of the algorithm is shortened by half. Although the processing speed is improved, the processing speed of 858 ms/framestill bcannot meet the engineering requirements. Therefore, inspired by the FT-LAB algorithm, a fast region-of-interest extraction method based on saliency region detection is presented in this paper. The method includes two main parts: the method of fast saliency map generation and the efficient method of target region segmentation. FT-LAB is first improved to adapt to embedded system-based saliency detection to detect the vehicle’s area of interest under UAV aerial video better.
Figure 1.
Comparisons between state-of-the-art saliency detection algorithms
In this section, we detail how to improve the frequency-tuned saliency region detection to make it more suitable for fast saliency region detection. The processing effects and running time of the algorithm based on three components of LAB and L component are obtained respectively. The general flow of the method is to first convert the image from RGB color space to Lab color space using the following formula and then generate RGB2Lab look-up tables, which are defined as Lf[r][g][b], af[r][g][b], andbf[r][g][b], where r, g, and b are three components of pixels in RGB color space.
,
Here, the L, a,and b look-up tables are shown as Equations (6)-(8) and can be calculated from Equations (1)-(5).
If the input image is a grayscale image, Equations (6)-(8) can be simplified to the lookup table of the L component,which is shown in Equation (9).
The average of the L, a,and b components of the whole imagelavg, aavg, and bavgare calculated firstly, and then slvec, savec, and sbvec areobtained by filtering the L, a, and b components using the difference of Gaussian (DoG) filter proposed in [28].
Where are the standard deviations of the Gaussian. A DoG filter is a simple band-pass filter whose passband width is controlled by the ratio . Let us consider combining several narrow band-pass DoGfilters. If we define and such that ,we find that a summation over DoG with standard deviations in the ratio results in:
For an integer , it is simply the difference of two Gaussians whose standard deviations can have any ratio .We follow the parameter selection section of [28] to set the parameter of theDoGfilter. Inspired by [28],the saliency map Sap for a grayscaleimage can be formulated as:
Where lavg is the mean value of L component of the whole image I, slvec(i,j) is the Gaussian blurred version of L component of the pixel (i,j) to eliminate fine texture details as well as noise and coding artifacts, and is the norm, which is the Euclidean distance.To extend Equation (12) to use features of color and luminance, we modified it as:
Where is the mean image feature vector of Lab color space and is the corresponding image pixel vector value in the Gaussian blurred version of the image. Here, we used a separate binomial kernel, and each pixel location is an vector using the Lab color space.
In Figure 2, (a) is the RGB test image of No. 5108 in the public test set, with a picture resolution of . (b) is the saliency map image of the FT algorithm, and the processing time is 452.17ms/frame. (c) is the result of our embedment of FT algorithm code[29]. The main modification is to change the vector variables in the original program to unsigned char * and double *, etc. We can see that the processing speed reached 50.76ms/frame shortened nearly tentimes. (d) is the result of processing using a look-up table generated using Equations (6), (7), and (8). The processing speed of the algorithm is reduced to 34.21ms/frame, which basically achieves the real-time processing under the condition of ensuring that the processing result of the algorithm is consistent with the original FT.In order to verify the processing effect of algorithms on the grayscale image, we also use the grayscale image data set to test the algorithms. (f) shows the saliency map result after reducing the algorithm in [28]; only the L component processed,and the processing speed of the algorithm is 177ms/frame. (g) is the saliency map result ifonly the L component is processed by our method, and the processing speed is reduced to 13.12 ms/frame. (h) is the result of using the look-up table generated by Equation (9), and the algorithm achieves a processing speed of 7.7ms/frame while ensuring the same processing result as FT.
Figure 2.
Saliency region detection results comparison between [28] and our methods
3. Target Region of Interest Segmentation Method
After the saliency map is extracted, a target segmentation method is needed to determine the position of the target in the image. The simplest and most common method is the threshold segmentation method, that is, set a fixed threshold. According to [28], the threshold is set to 100 for binary image segmentation. The method has the advantages of simple implementation and fast running speed. However, this method relies too much on prior knowledge and is not adaptive.The basic principle of the target segmentation algorithm based on the Booleanmaps [27] is to set several thresholds of the threshold segmentation method according to a certain interval. The interval set in [27] is 8, that is, the segmentation threshold is respectively set as 8, 16, 24, , 256. Then, a series of binary images are obtained to form a pool of target regionsof interest. Then, according to the principle that the target’s grayscale value is more stable than the background's, the number of times that the target appears in a certain position in the image is greater than a certain threshold to determine the target regions, and it is finally combined with OTSU[30] to determine the final target area.The method can extract the target of simple background effectively, but because of the need to deal with a large number of different binary images, the method of processing speed is slow; processing a frame takes about 27s (resolution 960 ).
An adaptive threshold target segmentation method based on mean-shift is proposedby [28]. The mean-shift segmentation algorithm that is performed in Lab color space provides better segmentation boundaries. Instead of applying a fixed threshold, an adaptive threshold that is image saliency dependent is also presented in their method to segment each image in their database.
Otsu’s Method is optimal and widely used for separating the target from its surrounds by computing a threshold maximizing the between-class variance. Experimental results show the method can separate the target well by using the threshold that is formed by OTSU’s result value for each image in every video sequence adding or subtracting a fixed value .
As shown in Figure 3, (a) is the result of Boolean maps. (b) is the result of mean-shift combined with setting segmentation method threshold to two times themean saliency of a given image. (c) is the result of original OTSU. (d),(e), and(f) are the results of [31] with different segmentation thresholds, whichare set to 2, 4, and 6 times themean saliency respectively. (g),(h),and (i) are the results from the OTSU method combined withHou's method using different thresholds.
Figure 3.
Comparison between target region of interest segmentation methods
In our method, the segmentation results of 2*Avg, OTSU and OTSU + 2*Avg are used to generate a pool P of regions, which is generated as follows: the Sobel filter is firstly used to detect the edge of the binary images of four segmentation methods illustrated in Figure 3, and then the binary and edge images are used as the input of connected domain extracting method to generate a set of target regions of interest(Rois)r.Astruct of Region_t is defined for later computations, and the elements in struct are as follows:
wid, hei, cx,andcy are the width, height, x coordinate of the center, and y coordinate of the center of the bounding box respectively.The bounding box is calculated by connected domain extracting method.
fill rate is defined as , where indicates the number of pixels whose grayscale value is 255 in region r.
aspect ratio is the ratio of width to height, which is calculated by wid/hei.
symmetry is a statistic to describe the symmetry of vehicles that are obviously symmetrical objects. According to the symmetry-based method described in our previous work[32], the symmetry measure method based on normalized entropy is applied to calculate the symmetry valueof ROIs. The symmetry is described as Equation (14):
Where is the symmetry value of thetarget. is the information entropy, which is also the mathematical expectation of information content. is the max value of information entropy. Inspired by[27], five definitions used for measuring region similarity between two labelled regions i and j are defined as follows:
$center \quad distance: D_{e}(i,j)=||c_{i}-c_{j}||^{2}, where || \quad || is l_{2}-norm. $
Taking account of target has a set of similar segmentation results in the four different binary images that were previously introduced. Supposing the pool P is formed by nRois, a clustering technique based on the spatial relationships and similarity between the regions is applied to cluster the regions belonging to the same target. Rois in the pool Pthatbelong to the same cluster Sk are firstly verified by Equation(20).
Typically, there are several Rois in each cluster. Equation (21) is used to find the accurate target representation ATR,which is the largest region in the three pairs of regions , , and belonging to the cluster Sk. The results of the target region of interest segmentation are shown in Figure 4.
Figure 4.
Results of target region of interest segmentation method
4. Vehicle Verification based on Horizontal Edge Wave
Although the methods described in Sections 2 and 3 perform well in vehicle detection, other objectssuch as trees, lane lines, and traffic signs are sometimes falsely detected as vehicles. Figure 5(a), (f) illustrates vehicles and false alarms detected by our target region of interest segmentation method respectively. In order to reduce these influences, in this section a vehicle verification algorithm is introduced. It can distinguish vehicles and false alarms effectively by taking into account the horizontal edge wave feature that we defined to describe man-made objects. We first use the Sobel operator-based edge detection algorithm to extract the horizontal edge of the Rois, which are shown in Figure 5(b) and (g). A horizontal edge pixel histogram(HEPH) is generated by summing edge pixels in each column, and then horizontal edge wavesthat are illustrated as Figure 5(c) and (h) are obtained by processing a Median filtering on HEPH.Experimental results show that vehicles have plenty of long horizontal edges (more than ten pixels in the same row). Figure 5(d), (i) are long horizontal edges of Rois, which are generated by using a filter on horizontal edge images. Figure 5(e), (j) shows horizontal edge waves of (d), (i) respectively.
Figure 5.
Vehicle (long) horizontal edges and their corresponding vehicle waves of Rois
After vehicle waves are generated, final bounding boxes of the vehicle can be accurately obtained by segmenting vehicle horizontal waves as Algorithm 1. The results are shown in Figure 6.
Figure 6.
Results of vehicle verification algorithm based on horizontal edge wave
Algorithm 1. Accurate bounding box generation method based on vehicle waves
Step 1. Generate threshold ThresholdhorWav.
The x-coordinates of the left and right borders of vehicles in the image are obtained by segmenting the vehicle horizontal waves with an adaptive threshold ThresholdhorWav,
Where HEPMi is the amount of horizontal edge pixels in each column of Rois.
Step 2. Get the x-coordinates of the left and right borders of vehicle detection region.
For a given vehicle horizontal wave, left border xl is the first column of vehicle waves whose HEPMi satisfies Equation (23), and xris the last column of vehicle waves where HEPMi satisfies Equation (23).
$HEPM_{i} \ge Threshold_{horWav}$
Step 3. Form a vehicle detection region (VDRn) whose width is and height is parameter her of Rois.
Step 4. Find the y-coordinates of the top and bottom borders of vehicle region.
Plenty of horizontal lines are contained in each VDRn. Experimental results show that the distance between two adjacent horizontal lines belonging to the same vehicles is short. An adaptive threshold is set according to the width of VDRn to satisfy various sizes of vehicles that are captured from UAVs at different distances and altitudes, where wid_VDR is the width of VDRn and Th_M is a constant value obtained from numerous vehicle image statistics. In the follow-up experiment, Th_Mis set to 5. Therefore, two adjacent lines belonging to the same vehicle area could be verified by the rules described in Algorithm 2.
Step.5 Output the x-coordinates and y-coordinates of the left-top and right-bottom of vehicles.
Algorithm 2. Vehicles top and bottom coordinates generation rules
Input: All horizontal lines Hlinei from top to bottom in VDRn.
Step 1. If Hlinei is the first line in VDRn,the top boundary of the first vehicle is obtained.
Step 2. If Hlinei is the last line in VDRn,the top boundary of the last vehicle is obtained.
Step 3. If the distance between Hlinei and Hlinei+1 is smaller than Th_Dis, Hlinei and Hlinei+1 are belonging to the same vehicle. Otherwise, Hlinei is the bottom line of the jth vehicle, and Hlinei+1 is the top line of the j+1th vehicle in VDRn.
Output: Pairs of top and bottom horizontal lines are regarded as the top and bottom borders of vehicles; therefore, the y-coordinates of the top and bottom borders of vehicle are obtained.
5. Experiments and Comparison
In order to evaluate the proposed UAV vehicle detection algorithm, the experiment platform was implemented in c using Open CV 2.4.8 library, Visual Studio 2010, and Code Composer Studio 5.5.0. The vehicle detection system is performed on video sequences with pixels resolutions in an Intel Core i5-4590 CPU@3.30GHz PC.
Our algorithm was evaluated using both simple and challenging conditions, and the videos were captured from a quad copter (model: dji PHANTOM 3 STANDARD) on urban road in different seasons (summer and winter).The performance evaluations of vehicle detection were based on low altitude UAV videos captured from three different scenarios with different driving conditions. The details of test videos are shown in Table 1.‘Test video 1’ is a multi-vehicle detection video sequence that was captured on urban road in winter, and the resolution of the video is 540.The scene in the video is simple, and the largest vehicle amount in one frame is two. ‘Test video 2’ was captured onurban road in summer, and the resolution of the video is 540. The scene is complicated and includes buildings, planes, and traffic signs.The largest vehicle amount in the video is three. ‘Test video 3’ was captured on urban road in summer, and the resolution of the video is also 540. The scene in the video is as complicated as ‘Test video 2’. The largest vehicle amount in the video is seven.
In this paper, four indicators are selected to evaluate the detection accuracy as shown in [17] including: Detection speed, which is in terms of processing time of each frame (ms/frame),Correctness, Completeness, and Quality.
Where TP is the number of detected vehicles,FP is the number of false alarms, FN is the number of vehicles missed, and Quality contains both possible detection errors (false positive and false negatives).Vehicle sizes are larger than .
To evaluate the effectiveness of our method, the FT+Mean-shift based algorithm and the UAV vehicle detection methods based on projection frame different(PFD) were compared. The source code of FT+Mean-shift was used for comparison,and it can be downloaded from their websites[29]. The general process of PFD is as follows: firstly, the projection match values of horizontal and vertical direction arecalculated, and the offsets of horizontal and vertical direction between adjacent frames are generated. Then, the frame different method is applied to detection the motion objects. Finally, the OTSU method is used to segment the vehicle in the image. The comparison results of three algorithms are shown in Figure 7, and the comparison of theCorrectness, Completeness, and Quality indicators for each of the three algorithms is illustrated in Table 2.
As shown in Figure 7 and Table 2, for ‘Test video 1’, the PFD method can quickly detect vehicles in images and the Completeness indicator reaches 100%. However, when the UAV moves faster, the shadow area of vehicles and other objects on the roadside are also detected, with the Correctness and Quality indicators both 34.2%. Although the FT+Mean-shift method can detect vehicles well, other objects on the road surface are also detected at the same time, resulting in many false positives.Because our method has been improved based on FT+Mean-shift, adding the vehicle judgment algorithm, and excluding a large number of interfering objects, Correctness and Quality are superior to PFD and FT+Mean-shift.However, our approach results in a small number of missed tests, so Completeness was 96.2% lower than PFD and FT+Mean-shift.For ‘Test video 2’, there is a problem that PFD has false detection frames, and many false positives and missing detections occur. Although the FT+Mean-shift method can effectively detect the vehicles appearing in the images, some non-vehicle areas are also detected due to the complexity of the video scene.Because the accurate bounding box generation method based on vehicle waves excludes most of the interference area, the Correctness and Quality indexes are better than FT+Mean-shift.
The CLcomparison between methods is shown in Table 3. TheMax, Min, and Avg are defined as the longest, shortest, andaverage processing time of each method. The PFD method is simple and easy to implement, and the CL isshown to be less than the computation load for our method.However, the detection results shown in Table 2 are much worse than our method. The mean-shift based segmentation method can segment the target position, but the algorithm processing time is too long (exceeds 30s) and cannot meet the engineering requirements.
In summary, the vehicle detection on unmanned aerial vehicle images based on saliency region detection proposed in this paper achieves avery robust performance. Thisrepresents a significant increase in the vehicle detection rateand a considerable decrease in the average processing time.
6. Conclusions
In this paper, we present a novel vehicle detection method on UAV images based on saliency region detection. There are three major contributions in this paper. First, a faster salient region detection method based on optimized frequency-turned to detect multiple vehicles in complex environments is proposed. Second, segmentation methods based on Boolean map and OTSU are combined to determine the ROI of vehicle targets in saliency map images. It can be used to solve the problem of high time consumption of mean-shift segmentation. Finally, we propose a series of vehicle apparent features-based methods based on geometry, symmetry, and horizontal edge wave, which are used to determine vehicles and eliminate the interference of roadside objects accurately. Experimental results indicate that our method can effectively and robustly detect multiple vehicles in complicated urban environments. A comparison analysis indicates that our algorithm is more robust under challenging conditions. Despite the improvements made in our algorithm, several issues remain. These issues include CL of our method, which increases as the number of vehicles increases. Until further research has been done to improve upon these issues, the novel method presented here outperforms current methods and shows high prospects for industrial applications.
Acknowledgments
The work described in this paper was funded by the Science and Technology Development Plan of Jilin Province (No. 20170204020GX) and National Natural Science Foundation of China (No.61602432, U1564211, and 51805203).
Research in road users behaviour typically depends on detailed observational data availability, particularly if the interest is in driving behaviour modelling. Among this type of data, vehicle trajectories are an important source of information for traffic flow theory, driving behaviour modelling, innovation in traffic management and safety and environmental studies. Recent developments in sensing technologies and image processing algorithms reduced the resources (time and costs) required for detailed traffic data collection, promoting the feasibility of site-based and vehicle-based naturalistic driving observation. For testing the core models of a traffic microsimulation application for safety assessment, vehicle trajectories were collected by remote sensing on a typical Portuguese suburban motorway. Multiple short flights over a stretch of an urban motorway allowed for the collection of several partial vehicle trajectories. In this paper the technical details of each step of the methodology used is presented: image collection, image processing, vehicle identification and vehicle tracking. To collect the images, a high-resolution camera was mounted on an aircraft's gyroscopic platform. The camera was connected to a DGPS for extraction of the camera position and allowed the collection of high resolution images at a low frame rate of 2s. After generic image orthorrectification using the flight details and the terrain model, computer vision techniques were used for fine rectification: the scale-invariant feature transform algorithm was used for detection and description of image features, and the random sample consensus algorithm for feature matching. Vehicle detection was carried out by median-based background subtraction. After the computation of the detected foreground and the shadow detection using a spectral ratio technique, region segmentation was used to identify candidates for vehicle positions. Finally, vehicles were tracked using a k- shortest disjoints paths algorithm. This approach allows for the optimization of an entire set of trajectories against all possible position candidates using motion-based optimization. Besides the importance of a new trajectory dataset that allows the development of new behavioural models and the validation of existing ones, this paper also describes the application of state-of-the-art algorithms and methods that significantly minimize the resources needed for such data collection.
A.C . Shastry and R.A. Schowengerdt,
“Airborne Video Registration and Traffic-Flow Parameter Estimation,”
IEEE Transactions on Intelligent Transportation Systems, Vol. 6, No. 4, pp. 391-405, December 2005
This paper investigates airborne helicopter video for estimating traffic parameters. Roll, pitch, and yaw of the helicopter make the video unstable, difficult to view, and the derived parameters less accurate. To correct this, a frame-by-frame video-registration technique using a feature tracker to automatically determine control-point correspondences is proposed. This converts the spatio-temporal video into temporal information, thereby correcting for airborne platform motion and attitude errors. The registration is robust, with the residual jitter being less than a few pixels over hundreds of frames. A simple vehicle-detection scheme identifies vehicle locations in the video, which are then tracked by the feature tracker, enabling us to estimate average velocity, instantaneous velocity, and other parameters automatically to within 10% of manual measurements. The entire process of registration, detection, tracking, and estimation takes only a few seconds for each frame. A prototype multimedia geographic information system (GIS) is created as a visualization tool for viewing the registered video, other airborne or satellite imagery, and data pertaining to georeferenced locations within a base map.
Y.Wu, H.Sun, P.Liu,
“A Novel Fast Detection Method of Infrared LSS-Target in Complex Urban Background,”
International Journal of Wavelets, Multiresolution and Information Processing, Vol. 16, No. 1, pp. 1850008, January 2018
LSS-Target (the Low altitude, Slow speed and Small Target) is likely to be a threat to the observation platform, thus infrared LSS-Target detection is an urgent task. LSS-Target is a challenging issue due to the low Signal-to-Noise Ratio (SNR) and sophisticated background. Motivated by the analysis of infrared imaging characteristics, this paper proposes a novel fusion method for IR LSS-Target detection with complex urban background, which is suitable for precise guidance and self defense. First, an adaptive threshold segmentation based on accumulative histogram and maximum likelihood estimation are utilized to eliminate the clutter and improve SNR of the initial image. Second, a template is set up to identify the seed points in the image. Third, a constrained four criteria region growth algorithm is performed to separate the entire regions. Finally, the confidence measure is constructed, which can eliminate false targets and the background edges. Experimental results show that the method in this paper ca...
H.Yalcin, M.Hebert, R.Collins, M. J.Black,
“A Flow-based Approach to Vehicle Detection and Background Mosaicking in Airborne Video,”
in Proceedings of 2005 IEEE Computer Society Conference on Computer Vision and Pattern Recognition (CVPR’05), Vol. 2, pp. 1202-1202, 2005
In this work, we address the detection of vehicles in a video stream obtained from a moving airborne platform. We propose a Bayesian framework for estimating dense optical flow over time that explicitly estimates a persistent model of background appearance. The approach assumes that the scene can be described by background and occlusion layers, estimated within an expectation-maximization framework. The mathematical formulation of the paper is an extension of the work in (H. Yalcin et al., 2005) where motion and appearance models for foreground and background layers are estimated simultaneously in a Bayesian framework.
T. S.C. Tan,
“Colour Texture Analysis using Colour Histogram,”
IEE Proceedings - Vision, Imageand Signal Processing, Vol. 141, No. 6, pp. 403, 1994
The authors describe a new and systematic way of analysing colour texture. They propose to extract both spatial (i.e. texture) and spectral (i.e. colour) attributes separately from a colour image. This involves a parallel system of representation comprising two channels, one for texture representation and the other for colour description. The spatial attributes are gathered by the `local linear transform' for texture representation as it is very suitable for statistical texture representation. The use of the three-dimensional colour histogram as the model for colour representation is proposed. As the storage and feature computation from the colour histogram are both very intensive, the authors advocate and justify the approximation of this histogram by the product of the three first-order histograms computed for the principal axis components of the colour image pixel data. Illumination invariant colour features are then defined as statistical descriptors of these lower dimensional histograms
H.Bay, A.Ess, T.Tuytelaars, L. VanGool,
“Speeded-Up Robust Features (SURF),”
Computer Vision and Image Understanding, Vol. 110, No. 3, pp. 346-359, June 2008
Effective and efficient generation of keypoints from an image is a well-studied problem in the literature and forms the basis of numerous Computer Vision applications. Established leaders in the field are the SIFT and SURF algorithms which exhibit great performance under a variety of image transformations, with SURF in particular considered as the most computationally efficient amongst the high-performance methods to date. In this paper we propose BRISK, a novel method for keypoint detection, description and matching. A comprehensive evaluation on benchmark datasets reveals BRISK's adaptive, high quality performance as in state-of-the-art algorithms, albeit at a dramatically lower computational cost (an order of magnitude faster than SURF in cases). The key to speed lies in the application of a novel scale-space FAST-based detector in combination with the assembly of a bit-string descriptor from intensity comparisons retrieved by dedicated sampling of each keypoint neighborhood.
A.Alahi, R.Ortiz, P.Vandergheynst,
“FREAK: Fast Retina Keypoint, ”
in Proceedings of 2012 IEEE Conference on Computer Vision and Pattern Recognition, pp. 510-517, 2012
Visual surveillance from low-altitude airborne platforms plays a key role in urban traffic surveillance. Moving vehicle detection and motion analysis are very important for such a system. However, illumination variance, scene complexity, and platform motion make the tasks very challenging. In addition, the used algorithms have to be computationally efficient in order to be used on a real-time platform. To deal with these problems, a new framework for vehicle detection and motion analysis from low-altitude airborne videos is proposed. Our paper has two major contributions. First, to speed up feature extraction and to retain additional global features in different scales for higher classification accuracy, a boosting light and pyramid sampling histogram of oriented gradients feature extraction method is proposed. Second, to efficiently correlate vehicles across different frames for vehicle motion trajectories computation, a spatio-temporal appearance-related similarity measure is proposed. Compared to other representative existing methods, our experimental results showed that the proposed method is able to achieve better performance with higher detection rate, lower false positive rate, and faster detection speed.
Given that ground stationary infrastructures for traffic monitoring are barely able to handle everyday traffic volumes, there is a risk that they could fail altogether in situations arising from mass events or disasters. In this work, we present an alternative approach for traffic monitoring during disaster and mass events, which is based on an airborne optical sensor system. With this system, optical image sequences are automatically examined on board an aircraft to estimate road traffic information, such as vehicle positions, velocities and driving directions. The traffic information, estimated in real time on board, is immediately downlinked to a ground station. The airborne sensor system consists of a three-head camera system, a real-time-capable GPS/INS unit, five industrial PCs and a downlink unit. The processing chain for automatic extraction of traffic information contains modules for the synchronization of image and navigation data streams, orthorectification and vehicle detection and tracking modules. The vehicle detector is based on a combination of AdaBoost and support vector machine classifiers. Vehicle tracking relies on shape-based matching operators. The processing chain is evaluated on a large number of image sequences recorded during several campaigns, and the data quality is compared to that obtained from induction loops. In summary, we can conclude that the achieved overall quality of the traffic data extracted by the airborne system is in the range of 68% and 81%. Thus, it is comparable to data obtained from stationary ground sensor networks.
X.Cao, C.Wu, P.Yan, X.Li,
“Linear SVM Classification using Boosting HOG Features for Vehicle Detection in Low-Altitude Airborne Videos, ”
in Proceedings of 2011 18th IEEE International Conference on Image Processing, pp. 2421-2424, 2011
Visual surveillance from low-altitude airborne platforms has been widely addressed in recent years. Moving vehicle detection is an important component of such a system, which is a very challenging task due to illumination variance and scene complexity. Therefore, a boosting Histogram Orientation Gradients (boosting HOG) feature is proposed in this paper. This feature is not sensitive to illumination change and shows better performance in characterizing object shape and appearance. Each of the boosting HOG feature is an output of an adaboost classifier, which is trained using all bins upon a cell in traditional HOG features. All boosting HOG features are combined to establish the final feature vector to train a linear SVM classifier for vehicle classification. Compared with classical approaches, the proposed method achieved better performance in higher detection rate, lower false positive rate and faster detection speed.
S.Tuermer, F.Kurz, P.Reinartz, U.Stilla,
“Airborne Vehicle Detection in Dense Urban Areas using HoG Features and Disparity Maps,”
IEEE Journal of Selected Topics in Applied Earth Observations and Remote Sensing, Vol. 6, No. 6, pp. 2327-2337, December 2013
Vehicle detection has been an important research field for years as there are a lot of valuable applications, ranging from support of traffic planners to real-time traffic management. Especially detection of cars in dense urban areas is of interest due to the high traffic volume and the limited space. In city areas many car-like objects (e.g., dormers) appear which might lead to confusion. Additionally, the inaccuracy of road databases supporting the extraction process has to be handled in a proper way. This paper describes an integrated real-time processing chain which utilizes multiple occurrence of objects in images. At least two subsequent images, data of exterior orientation, a global DEM, and a road database are used as input data. The segments of the road database are projected in the non-geocoded image using the corresponding height information from the global DEM. From amply masked road areas in both images a disparity map is calculated. This map is used to exclude elevated objects above a certain height (e.g., buildings and vegetation). Additionally, homogeneous areas are excluded by a fast region growing algorithm. Remaining parts of one input image are classified based on the 'Histogram of oriented Gradients (HoG)' features. The implemented approach has been verified using image sections from two different flights and manually extracted ground truth data from the inner city of Munich. The evaluation shows a quality of up to 70 percent.
P. F.Felzenszwalb, R. B.Girshick, D.McAllester, D.Ramanan,
“Object Detection with Discriminatively Trained Part-Based Models,”
IEEE Transactions on Pattern Analysis and Machine Intelligence, Vol. 32, No. 9, pp. 1627-1645, September 2010
This research develops an advanced vehicle detection method, which improves the original Viola-Jones (V-J) object detection scheme for better vehicle detections from low-altitude unmanned aerial vehicle (UAV) imagery. The original V-J method is sensitive to objects' in-plane rotation, and therefore has difficulties in detecting vehicles with unknown orientations in UAV images. To address this issue, this research proposes a road orientation adjustment method, which rotates each UAV image once so that the roads and on-road vehicles on rotated images will be aligned with the horizontal direction and the V-J vehicle detector. Then, the original V-J can be directly applied to achieve better efficiency and accuracy. The enhanced V-J method is further applied for vehicle tracking. Testing results show that both vehicle detection and tracking methods are competitive compared with other existing methods. Future research will focus on expanding the current methods to detect other transport modes, such as buses, trucks, motorcycles, bicycles, and pedestrians.
W.Li, P.Liu, Y.Wang, H.Ni, C.Wen, J.Fan,
“On-Board Robust Vehicle Detection using Knowledge-based Features and Motion Trajectory,”
International Journal of Signal Processing, Image Processingand Pattern Recognition, Vol. 8, No. 2, pp. 201-212, February 2015
Nowadays, many images of cropland are photographed and transferred02by wireless sensors in agricultural automation. But one contradiction02is that the recognition needs images with high quality and the
R.Achanta, F.Estrada, P.Wils, S.Süsstrunk,
“Salient Region Detection and Segmentation,”
in Proceedings of International Conference onComputer Vision Systems, pp. 66-75, Berlin, Heidelberg, 2008
Many successful models for predicting attention in a scene involve three main steps: convolution with a set of filters, a center-surround mechanism and spatial pooling to construct a saliency map. However, integrating spatial information and justifying the choice of various parameter values remain open problems. In this paper we show that an efficient model of color appearance in human vision, which contains a principled selection of parameters as well as an innate spatial pooling mechanism, can be generalized to obtain a saliency model that outperforms state-of-the-art models. Scale integration is achieved by an inverse wavelet transform over the set of scale-weighted center-surround responses. The scale-weighting function (termed ECSF) has been optimized to better replicate psychophysical data on color appearance, and the appropriate sizes of the center-surround inhibition windows have been determined by training a Gaussian Mixture Model on eye-fixation data, thus avoiding ad-hoc parameter selection. Additionally, we conclude that the extension of a color appearance model to saliency estimation adds to the evidence for a common low-level visual front-end for different visual tasks.
L.Zhang, M. H.Tong, T. K.Marks, H.Shan, G. W.Cottrell,
“SUN: A Bayesian Framework for Saliency using Natural Statistics,”
Journal of Vision, Vol. 8, No. 7, pp. 32, December 2008
Abstract We propose a definition of saliency by considering what the visual system is trying to optimize when directing attention. The resulting model is a Bayesian framework from which bottom-up saliency emerges naturally as the self-information of visual features, and overall saliency (incorporating top-down information with bottom-up saliency) emerges as the pointwise mutual information between the features and the target when searching for a target. An implementation of our framework demonstrates that our model's bottom-up saliency maps perform as well as or better than existing algorithms in predicting people's fixations in free viewing. Unlike existing saliency measures, which depend on the statistics of the particular image being viewed, our measure of saliency is derived from natural image statistics, obtained in advance from a collection of natural images. For this reason, we call our model SUN (Saliency Using Natural statistics). A measure of saliency based on natural image statistics, rather than based on a single test image, provides a straightforward explanation for many search asymmetries observed in humans; the statistics of a single test image lead to predictions that are not consistent with these asymmetries. In our model, saliency is computed locally, which is consistent with the neuroanatomy of the early visual system and results in an efficient algorithm with few free parameters.
D.Walther,
“Interactions of Visual Attention and Object Recognition: Computational Modeling, Algorithms, and Psychophysics,”
Selective visual attention provides an effective mechanism to serialize perception of complex scenes in both biological and machine vision systems. In extension of previous models of saliency-based visual attention by Koch & Ullman (Human Neurobiology, 4:219-227, 1985) and Itti et al. (IEEE PAMI, 20(11):1254-1259, 1998), we have developed a new model of bottom-up salient region selection, which estimates the approximate extent of attended proto-objects in a biologically realistic manner. Based on our model, we simulate the deployment of spatial attention in a biologically realistic model of object recognition in the cortex and find, in agreement with electrophysiology in macaque monkeys, that modulation of neural activity by as little as 20 % suffices to enable successive detection of multiple objects. We further show successful applications of the selective attention system to machine vision problems. We show that attentional grouping based on bottom-up processes enables successive learning and recognition of multiple objects in cluttered natural scenes. We also demonstrate that pre-selection of potential targets decreases the complexity of multiple target tracking in an application to detection and tracking of low-contrast marine animals in underwater video data. A given task will affect visual perception through top-down attention processes. Frequently, a task implies attention to particular objects or object categories. Finding suitable features can be interpreted as an inversion of object detection. Where object detection entails mapping from a set of sufficiently complex features to an abstract object representation, finding features for top-down attention requires the reverse of this mapping. We demonstrate a computer simulation of this mechanism with the example of top-down attention to faces. Deploying top-down attention to the visual hierarchy comes at a cost in reaction time in fast detection tasks. We use a task switching paradigm to compare task switches that do with those that do not require re-deployment of top-down attention and find a cost of 20-28 ms in reaction time for shifting attention from one stimulus attribute (image content) to another (color of frame).
J.Lou, W.Zhu, H.Wang, M.Ren,
“Small Target Detection Combining Regional Stability and Saliency in a Color Image,”
Multimedia Tools and Applications, Vol. 76, No. 13, pp. 14781-14798, July 2017
Abstract In this paper, we will address the issue of detecting small target in a color image from the perspectives of both stability and saliency. First, we consider small target detection as a stable region extraction problem. Several stability criteria are applied to generate a stability map, which involves a set of locally stable regions derived from sequential boolean maps. Second, considering the local contrast of a small target and its surroundings, we obtain a saliency map by comparing the color vector of each pixel with its Gaussian blurred version. Finally, both the stability and saliency maps are integrated in a pixel-wise multiplication manner for removing false alarms. In addition, we introduce a set of integration models by combining several existing stability and saliency methods, and use them to indicate the validity of the proposed framework. Experimental results show that our model adapts to target size variations and performs favorably in terms of precision, recall and F-measure on three challenging datasets.
R.Achanta, S.Hemami, F.Estrada, S.Susstrunk,
“Frequency-Tuned Salient Region Detection,”
in Proceedings of 2009 IEEE Conference on Computer Vision and Pattern Recognition, pp. 1597-1604, 2009
The ability of human visual system to detect visual saliency is extraordinarily fast and reliable. However, computational modeling of this basic intelligent behavior still remains a challenge. This paper presents a simple method for the visual saliency detection. Our model is independent of features, categories, or other forms of prior knowledge of the objects. By analyzing the log-spectrum of an input image, we extract the spectral residual of an image in spectral domain, and propose a fast method to construct the corresponding saliency map in spatial domain. We test this model on both natural pictures and artificial images such as psychological patterns. The result indicate fast and robust saliency detection of our method.
W.Li, P.Liu, Y.Wang, H.Ni,
“Multifeature Fusion Vehicle Detection Algorithm based on Choquet Integral,”
“Object Tracking in Vary Lighting Conditions for Fog based Intelligent Surveillance of Public Spaces,”
1
2018
... Target detection and tracking technology is a key technology in the field of computer vision, and it has attracted the attention of scholars. In the fields of drone aerial photography, target detection and tracking are indispensable for tracking shooting[1]. Therefore, target detection and tracking technology is an important research direction in the field of UAV aerial photography. In addition, the target in the aerial video is small and the background is complex. Target detection is easily affected by interferences of scale changing, rotation, light variation, occlusion, and camera shaking, which makes the detection and tracking of targets in aerial video more difficult. ...
“Automatic Vehicle Trajectory Extraction by Aerial Remote Sensing,”
2
2014
... (1) Target detection method based on frame difference[2-4]. The moving target is determined mainly by grayscale value difference between pixels in the same position of two successive frames. [2] applied a background subtraction method based on median to detect vehicles. [3]applied a frame difference method, combining with the image registration process to detect moving vehicles. The frame difference-based algorithm is simple to operate and easy to implement; however, this algorithm is only suitable for the target detection in static background. In other words, it is only applicable to the detection of moving targets in the hovering state of a UAV, and the application range is limited. ...
... ]. The moving target is determined mainly by grayscale value difference between pixels in the same position of two successive frames. [2] applied a background subtraction method based on median to detect vehicles. [3]applied a frame difference method, combining with the image registration process to detect moving vehicles. The frame difference-based algorithm is simple to operate and easy to implement; however, this algorithm is only suitable for the target detection in static background. In other words, it is only applicable to the detection of moving targets in the hovering state of a UAV, and the application range is limited. ...
“Airborne Video Registration and Traffic-Flow Parameter Estimation,”
1
2005
... (1) Target detection method based on frame difference[2-4]. The moving target is determined mainly by grayscale value difference between pixels in the same position of two successive frames. [2] applied a background subtraction method based on median to detect vehicles. [3]applied a frame difference method, combining with the image registration process to detect moving vehicles. The frame difference-based algorithm is simple to operate and easy to implement; however, this algorithm is only suitable for the target detection in static background. In other words, it is only applicable to the detection of moving targets in the hovering state of a UAV, and the application range is limited. ...
“A Novel Fast Detection Method of Infrared LSS-Target in Complex Urban Background,”
1
2018
... (1) Target detection method based on frame difference[2-4]. The moving target is determined mainly by grayscale value difference between pixels in the same position of two successive frames. [2] applied a background subtraction method based on median to detect vehicles. [3]applied a frame difference method, combining with the image registration process to detect moving vehicles. The frame difference-based algorithm is simple to operate and easy to implement; however, this algorithm is only suitable for the target detection in static background. In other words, it is only applicable to the detection of moving targets in the hovering state of a UAV, and the application range is limited. ...
“A Flow-based Approach to Vehicle Detection and Background Mosaicking in Airborne Video,”
1
2005
... (2) Target detection method based on optical flow[5]. The optical flow-based method uses the optical flow as the instantaneous field of grayscale pixel in the image to achieve the target detection. The optical flow-based method is mainly divided into four categories according to the principle: a gradient-based method, a matching-based method, an energy-based method, and a phase-based method. However, optical flow methods are sensitive to background motions. ...
“Colour Texture Analysis using Colour Histogram,”
1
1994
... (3) Target detection method based on feature matching. The target template is established by extracting the features of the target to be detected (corner features, colour features, etc.), and then the similarity of the target template in the real-time video is extracted to detect the target. At present, the most commonly used feature matching algorithms are SIFT [6], SURF[7], BRISK [8], and FREAK [9]. Feature matching is the most widely used target detection and recognition algorithm, and the feature matching algorithm is suitable for both the target detection of dynamic background and the detection of static targets [10]. ...
“Speeded-Up Robust Features (SURF),”
1
2008
... (3) Target detection method based on feature matching. The target template is established by extracting the features of the target to be detected (corner features, colour features, etc.), and then the similarity of the target template in the real-time video is extracted to detect the target. At present, the most commonly used feature matching algorithms are SIFT [6], SURF[7], BRISK [8], and FREAK [9]. Feature matching is the most widely used target detection and recognition algorithm, and the feature matching algorithm is suitable for both the target detection of dynamic background and the detection of static targets [10]. ...
... (3) Target detection method based on feature matching. The target template is established by extracting the features of the target to be detected (corner features, colour features, etc.), and then the similarity of the target template in the real-time video is extracted to detect the target. At present, the most commonly used feature matching algorithms are SIFT [6], SURF[7], BRISK [8], and FREAK [9]. Feature matching is the most widely used target detection and recognition algorithm, and the feature matching algorithm is suitable for both the target detection of dynamic background and the detection of static targets [10]. ...
“FREAK: Fast Retina Keypoint, ”
1
2012
... (3) Target detection method based on feature matching. The target template is established by extracting the features of the target to be detected (corner features, colour features, etc.), and then the similarity of the target template in the real-time video is extracted to detect the target. At present, the most commonly used feature matching algorithms are SIFT [6], SURF[7], BRISK [8], and FREAK [9]. Feature matching is the most widely used target detection and recognition algorithm, and the feature matching algorithm is suitable for both the target detection of dynamic background and the detection of static targets [10]. ...
“Numeric Characteristics of Generalized M-Set with its Asymptote,”
1
2014
... (3) Target detection method based on feature matching. The target template is established by extracting the features of the target to be detected (corner features, colour features, etc.), and then the similarity of the target template in the real-time video is extracted to detect the target. At present, the most commonly used feature matching algorithms are SIFT [6], SURF[7], BRISK [8], and FREAK [9]. Feature matching is the most widely used target detection and recognition algorithm, and the feature matching algorithm is suitable for both the target detection of dynamic background and the detection of static targets [10]. ...
“Vehicle Detection and Motion Analysis in Low-Altitude Airborne Video under Urban Environment,”
1
2011
... (4) Target detection algorithms based on machine learning. In recent years, object detection algorithms, such as bLPS-HOG+SVM[11], V-J+SVM[12], HOG+SVM[13], Disparity Maps + HOG based detector[14], discriminatively trained deformable part model(DPM)[15], and V-J object detection scheme[16],have become popular for vehicle detection in UAV videos. Object detection algorithms are less sensitive to image noise, background motions, and scene complexity.Therefore,they are more robust[17]. However, due to the computational complexity, the machine learning-based method is slow in detecting multiple objects and therefore cannot satisfy the requirement of real-time applications. ...
“An Operational System for Estimating Road Traffic Information from Aerial Images,”
1
2014
... (4) Target detection algorithms based on machine learning. In recent years, object detection algorithms, such as bLPS-HOG+SVM[11], V-J+SVM[12], HOG+SVM[13], Disparity Maps + HOG based detector[14], discriminatively trained deformable part model(DPM)[15], and V-J object detection scheme[16],have become popular for vehicle detection in UAV videos. Object detection algorithms are less sensitive to image noise, background motions, and scene complexity.Therefore,they are more robust[17]. However, due to the computational complexity, the machine learning-based method is slow in detecting multiple objects and therefore cannot satisfy the requirement of real-time applications. ...
“Linear SVM Classification using Boosting HOG Features for Vehicle Detection in Low-Altitude Airborne Videos, ”
1
2011
... (4) Target detection algorithms based on machine learning. In recent years, object detection algorithms, such as bLPS-HOG+SVM[11], V-J+SVM[12], HOG+SVM[13], Disparity Maps + HOG based detector[14], discriminatively trained deformable part model(DPM)[15], and V-J object detection scheme[16],have become popular for vehicle detection in UAV videos. Object detection algorithms are less sensitive to image noise, background motions, and scene complexity.Therefore,they are more robust[17]. However, due to the computational complexity, the machine learning-based method is slow in detecting multiple objects and therefore cannot satisfy the requirement of real-time applications. ...
“Airborne Vehicle Detection in Dense Urban Areas using HoG Features and Disparity Maps,”
1
2013
... (4) Target detection algorithms based on machine learning. In recent years, object detection algorithms, such as bLPS-HOG+SVM[11], V-J+SVM[12], HOG+SVM[13], Disparity Maps + HOG based detector[14], discriminatively trained deformable part model(DPM)[15], and V-J object detection scheme[16],have become popular for vehicle detection in UAV videos. Object detection algorithms are less sensitive to image noise, background motions, and scene complexity.Therefore,they are more robust[17]. However, due to the computational complexity, the machine learning-based method is slow in detecting multiple objects and therefore cannot satisfy the requirement of real-time applications. ...
“Object Detection with Discriminatively Trained Part-Based Models,”
1
2010
... (4) Target detection algorithms based on machine learning. In recent years, object detection algorithms, such as bLPS-HOG+SVM[11], V-J+SVM[12], HOG+SVM[13], Disparity Maps + HOG based detector[14], discriminatively trained deformable part model(DPM)[15], and V-J object detection scheme[16],have become popular for vehicle detection in UAV videos. Object detection algorithms are less sensitive to image noise, background motions, and scene complexity.Therefore,they are more robust[17]. However, due to the computational complexity, the machine learning-based method is slow in detecting multiple objects and therefore cannot satisfy the requirement of real-time applications. ...
“Vehicle Detection and Tracking from Airborne Images,”
1
2015
... (4) Target detection algorithms based on machine learning. In recent years, object detection algorithms, such as bLPS-HOG+SVM[11], V-J+SVM[12], HOG+SVM[13], Disparity Maps + HOG based detector[14], discriminatively trained deformable part model(DPM)[15], and V-J object detection scheme[16],have become popular for vehicle detection in UAV videos. Object detection algorithms are less sensitive to image noise, background motions, and scene complexity.Therefore,they are more robust[17]. However, due to the computational complexity, the machine learning-based method is slow in detecting multiple objects and therefore cannot satisfy the requirement of real-time applications. ...
... (4) Target detection algorithms based on machine learning. In recent years, object detection algorithms, such as bLPS-HOG+SVM[11], V-J+SVM[12], HOG+SVM[13], Disparity Maps + HOG based detector[14], discriminatively trained deformable part model(DPM)[15], and V-J object detection scheme[16],have become popular for vehicle detection in UAV videos. Object detection algorithms are less sensitive to image noise, background motions, and scene complexity.Therefore,they are more robust[17]. However, due to the computational complexity, the machine learning-based method is slow in detecting multiple objects and therefore cannot satisfy the requirement of real-time applications. ...
... In this paper, four indicators are selected to evaluate the detection accuracy as shown in [17] including: Detection speed, which is in terms of processing time of each frame (ms/frame),Correctness, Completeness, and Quality. ...
“On-Board Robust Vehicle Detection using Knowledge-based Features and Motion Trajectory,”
1
2015
... Through the analysis of the test videos and vehicle samples under a large number of UAV aerial images, we found that vehicles have significant visual salient features with respect to the road surface and most of the background area. In addition, the results of our previous work[18] show that the pixel grayscale values in the shadow area at the bottom of the vehicle basically all fall within the first 5% of the grayscale histogram of entire image. However, only the vehicle bottom shadow region can be detected by using the shadow detection method. Using the visual saliency detection method can not only detect the vehicle region, but also detect the shadow region under the vehicle in the image; this can increase the probability of extracting the vehicle region of interest[19]. Therefore, we first use the visual saliency detection method to determine the region of interest of the vehicle in the aerial image. At present, the target detection method based on saliency detection is a research hotspot in the field of target detection. ...
“A Fractal Image Encoding Method based on Statistical Loss Used in Agricultural Image Compression,”
1
2016
... Through the analysis of the test videos and vehicle samples under a large number of UAV aerial images, we found that vehicles have significant visual salient features with respect to the road surface and most of the background area. In addition, the results of our previous work[18] show that the pixel grayscale values in the shadow area at the bottom of the vehicle basically all fall within the first 5% of the grayscale histogram of entire image. However, only the vehicle bottom shadow region can be detected by using the shadow detection method. Using the visual saliency detection method can not only detect the vehicle region, but also detect the shadow region under the vehicle in the image; this can increase the probability of extracting the vehicle region of interest[19]. Therefore, we first use the visual saliency detection method to determine the region of interest of the vehicle in the aerial image. At present, the target detection method based on saliency detection is a research hotspot in the field of target detection. ...
“Salient Region Detection and Segmentation,”
1
2008
... In recent years, a large number of saliency detection methods have emerged. Figure 1 illustrates comparison results between state-of-the-art saliency detection algorithms that are processed on the data set in the experiment section of this paper: (a) is the original image, (b) is the grayscale image of (a), (c) is the ground truth, (d-n) are the respective saliency map results of AC [20], RC [21], HC [22], LC [23], IM [24], SUN and SUN-CON [25], IT [26], SaliencyMap [27], and FT-LAB and FT-L [28], which are processed on Frame #70 of testvideo1 (video resolution: 960×540) in our data set. Experimental results show that the AC, RC, LC, HC, and IT methods can quickly detect the target region in the image. However, as can be seen from Figure 1 (d), (e), (f), and (g), except for the target, the saliency eigenvalues are relatively close to a large number of interference regions; therefore, the subsequent segmentation algorithm will split out more interference regions. It can be seen from Figure 1 (h), (i), and (j) that the detection results of IM, SUN, and SUN-CON are quite satisfactory; however, the processing times of these three algorithms all exceed 2900ms. The algorithm has high complexity and cannot be applied to real-time detection system. The principle of the Saliency Map and FT-LAB are roughly the same; however, since FT-LAB performs Gaussian smoothing on the L, A, and B components of the LAB color space of the image, the complexity of the algorithm is relatively high. If the FT-LAB is reduced and only the L channel is processed, the processing result of the algorithm is shown in Figure 1 (a). It is almost the same as FT-LAB, and the processing speed of the algorithm is shortened by half. Although the processing speed is improved, the processing speed of 858 ms/framestill bcannot meet the engineering requirements. Therefore, inspired by the FT-LAB algorithm, a fast region-of-interest extraction method based on saliency region detection is presented in this paper. The method includes two main parts: the method of fast saliency map generation and the efficient method of target region segmentation. FT-LAB is first improved to adapt to embedded system-based saliency detection to detect the vehicle’s area of interest under UAV aerial video better. ...
“Global Contrast based Salient Region Detection,”
1
2015
... In recent years, a large number of saliency detection methods have emerged. Figure 1 illustrates comparison results between state-of-the-art saliency detection algorithms that are processed on the data set in the experiment section of this paper: (a) is the original image, (b) is the grayscale image of (a), (c) is the ground truth, (d-n) are the respective saliency map results of AC [20], RC [21], HC [22], LC [23], IM [24], SUN and SUN-CON [25], IT [26], SaliencyMap [27], and FT-LAB and FT-L [28], which are processed on Frame #70 of testvideo1 (video resolution: 960×540) in our data set. Experimental results show that the AC, RC, LC, HC, and IT methods can quickly detect the target region in the image. However, as can be seen from Figure 1 (d), (e), (f), and (g), except for the target, the saliency eigenvalues are relatively close to a large number of interference regions; therefore, the subsequent segmentation algorithm will split out more interference regions. It can be seen from Figure 1 (h), (i), and (j) that the detection results of IM, SUN, and SUN-CON are quite satisfactory; however, the processing times of these three algorithms all exceed 2900ms. The algorithm has high complexity and cannot be applied to real-time detection system. The principle of the Saliency Map and FT-LAB are roughly the same; however, since FT-LAB performs Gaussian smoothing on the L, A, and B components of the LAB color space of the image, the complexity of the algorithm is relatively high. If the FT-LAB is reduced and only the L channel is processed, the processing result of the algorithm is shown in Figure 1 (a). It is almost the same as FT-LAB, and the processing speed of the algorithm is shortened by half. Although the processing speed is improved, the processing speed of 858 ms/framestill bcannot meet the engineering requirements. Therefore, inspired by the FT-LAB algorithm, a fast region-of-interest extraction method based on saliency region detection is presented in this paper. The method includes two main parts: the method of fast saliency map generation and the efficient method of target region segmentation. FT-LAB is first improved to adapt to embedded system-based saliency detection to detect the vehicle’s area of interest under UAV aerial video better. ...
“Global Contrast based Salient Region Detection,”
1
2011
... In recent years, a large number of saliency detection methods have emerged. Figure 1 illustrates comparison results between state-of-the-art saliency detection algorithms that are processed on the data set in the experiment section of this paper: (a) is the original image, (b) is the grayscale image of (a), (c) is the ground truth, (d-n) are the respective saliency map results of AC [20], RC [21], HC [22], LC [23], IM [24], SUN and SUN-CON [25], IT [26], SaliencyMap [27], and FT-LAB and FT-L [28], which are processed on Frame #70 of testvideo1 (video resolution: 960×540) in our data set. Experimental results show that the AC, RC, LC, HC, and IT methods can quickly detect the target region in the image. However, as can be seen from Figure 1 (d), (e), (f), and (g), except for the target, the saliency eigenvalues are relatively close to a large number of interference regions; therefore, the subsequent segmentation algorithm will split out more interference regions. It can be seen from Figure 1 (h), (i), and (j) that the detection results of IM, SUN, and SUN-CON are quite satisfactory; however, the processing times of these three algorithms all exceed 2900ms. The algorithm has high complexity and cannot be applied to real-time detection system. The principle of the Saliency Map and FT-LAB are roughly the same; however, since FT-LAB performs Gaussian smoothing on the L, A, and B components of the LAB color space of the image, the complexity of the algorithm is relatively high. If the FT-LAB is reduced and only the L channel is processed, the processing result of the algorithm is shown in Figure 1 (a). It is almost the same as FT-LAB, and the processing speed of the algorithm is shortened by half. Although the processing speed is improved, the processing speed of 858 ms/framestill bcannot meet the engineering requirements. Therefore, inspired by the FT-LAB algorithm, a fast region-of-interest extraction method based on saliency region detection is presented in this paper. The method includes two main parts: the method of fast saliency map generation and the efficient method of target region segmentation. FT-LAB is first improved to adapt to embedded system-based saliency detection to detect the vehicle’s area of interest under UAV aerial video better. ...
“Visual Attention Detection in Video Sequences using Spatiotemporal Cues,”
1
2006
... In recent years, a large number of saliency detection methods have emerged. Figure 1 illustrates comparison results between state-of-the-art saliency detection algorithms that are processed on the data set in the experiment section of this paper: (a) is the original image, (b) is the grayscale image of (a), (c) is the ground truth, (d-n) are the respective saliency map results of AC [20], RC [21], HC [22], LC [23], IM [24], SUN and SUN-CON [25], IT [26], SaliencyMap [27], and FT-LAB and FT-L [28], which are processed on Frame #70 of testvideo1 (video resolution: 960×540) in our data set. Experimental results show that the AC, RC, LC, HC, and IT methods can quickly detect the target region in the image. However, as can be seen from Figure 1 (d), (e), (f), and (g), except for the target, the saliency eigenvalues are relatively close to a large number of interference regions; therefore, the subsequent segmentation algorithm will split out more interference regions. It can be seen from Figure 1 (h), (i), and (j) that the detection results of IM, SUN, and SUN-CON are quite satisfactory; however, the processing times of these three algorithms all exceed 2900ms. The algorithm has high complexity and cannot be applied to real-time detection system. The principle of the Saliency Map and FT-LAB are roughly the same; however, since FT-LAB performs Gaussian smoothing on the L, A, and B components of the LAB color space of the image, the complexity of the algorithm is relatively high. If the FT-LAB is reduced and only the L channel is processed, the processing result of the algorithm is shown in Figure 1 (a). It is almost the same as FT-LAB, and the processing speed of the algorithm is shortened by half. Although the processing speed is improved, the processing speed of 858 ms/framestill bcannot meet the engineering requirements. Therefore, inspired by the FT-LAB algorithm, a fast region-of-interest extraction method based on saliency region detection is presented in this paper. The method includes two main parts: the method of fast saliency map generation and the efficient method of target region segmentation. FT-LAB is first improved to adapt to embedded system-based saliency detection to detect the vehicle’s area of interest under UAV aerial video better. ...
“Saliency Estimation using a Non-Parametric Low-Level Vision Model,”
2
2011
... In recent years, a large number of saliency detection methods have emerged. Figure 1 illustrates comparison results between state-of-the-art saliency detection algorithms that are processed on the data set in the experiment section of this paper: (a) is the original image, (b) is the grayscale image of (a), (c) is the ground truth, (d-n) are the respective saliency map results of AC [20], RC [21], HC [22], LC [23], IM [24], SUN and SUN-CON [25], IT [26], SaliencyMap [27], and FT-LAB and FT-L [28], which are processed on Frame #70 of testvideo1 (video resolution: 960×540) in our data set. Experimental results show that the AC, RC, LC, HC, and IT methods can quickly detect the target region in the image. However, as can be seen from Figure 1 (d), (e), (f), and (g), except for the target, the saliency eigenvalues are relatively close to a large number of interference regions; therefore, the subsequent segmentation algorithm will split out more interference regions. It can be seen from Figure 1 (h), (i), and (j) that the detection results of IM, SUN, and SUN-CON are quite satisfactory; however, the processing times of these three algorithms all exceed 2900ms. The algorithm has high complexity and cannot be applied to real-time detection system. The principle of the Saliency Map and FT-LAB are roughly the same; however, since FT-LAB performs Gaussian smoothing on the L, A, and B components of the LAB color space of the image, the complexity of the algorithm is relatively high. If the FT-LAB is reduced and only the L channel is processed, the processing result of the algorithm is shown in Figure 1 (a). It is almost the same as FT-LAB, and the processing speed of the algorithm is shortened by half. Although the processing speed is improved, the processing speed of 858 ms/framestill bcannot meet the engineering requirements. Therefore, inspired by the FT-LAB algorithm, a fast region-of-interest extraction method based on saliency region detection is presented in this paper. The method includes two main parts: the method of fast saliency map generation and the efficient method of target region segmentation. FT-LAB is first improved to adapt to embedded system-based saliency detection to detect the vehicle’s area of interest under UAV aerial video better. ...
... Algorithm indicators comparison
Scene
Metrics
PFD
FT + Mean-shift [24]
Our Method
Test video 1
Correctness (%)
34.2
27.3
85.8
Completeness (%)
100
100
96.2
Quality (%)
34.2
27.3
82.9
Test video 2
Correctness (%)
47.7
9.3
93.3
Completeness (%)
69.9
100
100
Quality (%)
39.6
9.3
93.3
Test video 3
Correctness (%)
12.1
12.9
90.4
Completeness (%)
95.2
96.0
95.5
Quality (%)
10.5
11.4
44.1
As shown in Figure 7 and Table 2, for ‘Test video 1’, the PFD method can quickly detect vehicles in images and the Completeness indicator reaches 100%. However, when the UAV moves faster, the shadow area of vehicles and other objects on the roadside are also detected, with the Correctness and Quality indicators both 34.2%. Although the FT+Mean-shift method can detect vehicles well, other objects on the road surface are also detected at the same time, resulting in many false positives.Because our method has been improved based on FT+Mean-shift, adding the vehicle judgment algorithm, and excluding a large number of interfering objects, Correctness and Quality are superior to PFD and FT+Mean-shift.However, our approach results in a small number of missed tests, so Completeness was 96.2% lower than PFD and FT+Mean-shift.For ‘Test video 2’, there is a problem that PFD has false detection frames, and many false positives and missing detections occur. Although the FT+Mean-shift method can effectively detect the vehicles appearing in the images, some non-vehicle areas are also detected due to the complexity of the video scene.Because the accurate bounding box generation method based on vehicle waves excludes most of the interference area, the Correctness and Quality indexes are better than FT+Mean-shift. ...
“SUN: A Bayesian Framework for Saliency using Natural Statistics,”
1
2008
... In recent years, a large number of saliency detection methods have emerged. Figure 1 illustrates comparison results between state-of-the-art saliency detection algorithms that are processed on the data set in the experiment section of this paper: (a) is the original image, (b) is the grayscale image of (a), (c) is the ground truth, (d-n) are the respective saliency map results of AC [20], RC [21], HC [22], LC [23], IM [24], SUN and SUN-CON [25], IT [26], SaliencyMap [27], and FT-LAB and FT-L [28], which are processed on Frame #70 of testvideo1 (video resolution: 960×540) in our data set. Experimental results show that the AC, RC, LC, HC, and IT methods can quickly detect the target region in the image. However, as can be seen from Figure 1 (d), (e), (f), and (g), except for the target, the saliency eigenvalues are relatively close to a large number of interference regions; therefore, the subsequent segmentation algorithm will split out more interference regions. It can be seen from Figure 1 (h), (i), and (j) that the detection results of IM, SUN, and SUN-CON are quite satisfactory; however, the processing times of these three algorithms all exceed 2900ms. The algorithm has high complexity and cannot be applied to real-time detection system. The principle of the Saliency Map and FT-LAB are roughly the same; however, since FT-LAB performs Gaussian smoothing on the L, A, and B components of the LAB color space of the image, the complexity of the algorithm is relatively high. If the FT-LAB is reduced and only the L channel is processed, the processing result of the algorithm is shown in Figure 1 (a). It is almost the same as FT-LAB, and the processing speed of the algorithm is shortened by half. Although the processing speed is improved, the processing speed of 858 ms/framestill bcannot meet the engineering requirements. Therefore, inspired by the FT-LAB algorithm, a fast region-of-interest extraction method based on saliency region detection is presented in this paper. The method includes two main parts: the method of fast saliency map generation and the efficient method of target region segmentation. FT-LAB is first improved to adapt to embedded system-based saliency detection to detect the vehicle’s area of interest under UAV aerial video better. ...
“Interactions of Visual Attention and Object Recognition: Computational Modeling, Algorithms, and Psychophysics,”
1
2006
... In recent years, a large number of saliency detection methods have emerged. Figure 1 illustrates comparison results between state-of-the-art saliency detection algorithms that are processed on the data set in the experiment section of this paper: (a) is the original image, (b) is the grayscale image of (a), (c) is the ground truth, (d-n) are the respective saliency map results of AC [20], RC [21], HC [22], LC [23], IM [24], SUN and SUN-CON [25], IT [26], SaliencyMap [27], and FT-LAB and FT-L [28], which are processed on Frame #70 of testvideo1 (video resolution: 960×540) in our data set. Experimental results show that the AC, RC, LC, HC, and IT methods can quickly detect the target region in the image. However, as can be seen from Figure 1 (d), (e), (f), and (g), except for the target, the saliency eigenvalues are relatively close to a large number of interference regions; therefore, the subsequent segmentation algorithm will split out more interference regions. It can be seen from Figure 1 (h), (i), and (j) that the detection results of IM, SUN, and SUN-CON are quite satisfactory; however, the processing times of these three algorithms all exceed 2900ms. The algorithm has high complexity and cannot be applied to real-time detection system. The principle of the Saliency Map and FT-LAB are roughly the same; however, since FT-LAB performs Gaussian smoothing on the L, A, and B components of the LAB color space of the image, the complexity of the algorithm is relatively high. If the FT-LAB is reduced and only the L channel is processed, the processing result of the algorithm is shown in Figure 1 (a). It is almost the same as FT-LAB, and the processing speed of the algorithm is shortened by half. Although the processing speed is improved, the processing speed of 858 ms/framestill bcannot meet the engineering requirements. Therefore, inspired by the FT-LAB algorithm, a fast region-of-interest extraction method based on saliency region detection is presented in this paper. The method includes two main parts: the method of fast saliency map generation and the efficient method of target region segmentation. FT-LAB is first improved to adapt to embedded system-based saliency detection to detect the vehicle’s area of interest under UAV aerial video better. ...
“Small Target Detection Combining Regional Stability and Saliency in a Color Image,”
4
2017
... In recent years, a large number of saliency detection methods have emerged. Figure 1 illustrates comparison results between state-of-the-art saliency detection algorithms that are processed on the data set in the experiment section of this paper: (a) is the original image, (b) is the grayscale image of (a), (c) is the ground truth, (d-n) are the respective saliency map results of AC [20], RC [21], HC [22], LC [23], IM [24], SUN and SUN-CON [25], IT [26], SaliencyMap [27], and FT-LAB and FT-L [28], which are processed on Frame #70 of testvideo1 (video resolution: 960×540) in our data set. Experimental results show that the AC, RC, LC, HC, and IT methods can quickly detect the target region in the image. However, as can be seen from Figure 1 (d), (e), (f), and (g), except for the target, the saliency eigenvalues are relatively close to a large number of interference regions; therefore, the subsequent segmentation algorithm will split out more interference regions. It can be seen from Figure 1 (h), (i), and (j) that the detection results of IM, SUN, and SUN-CON are quite satisfactory; however, the processing times of these three algorithms all exceed 2900ms. The algorithm has high complexity and cannot be applied to real-time detection system. The principle of the Saliency Map and FT-LAB are roughly the same; however, since FT-LAB performs Gaussian smoothing on the L, A, and B components of the LAB color space of the image, the complexity of the algorithm is relatively high. If the FT-LAB is reduced and only the L channel is processed, the processing result of the algorithm is shown in Figure 1 (a). It is almost the same as FT-LAB, and the processing speed of the algorithm is shortened by half. Although the processing speed is improved, the processing speed of 858 ms/framestill bcannot meet the engineering requirements. Therefore, inspired by the FT-LAB algorithm, a fast region-of-interest extraction method based on saliency region detection is presented in this paper. The method includes two main parts: the method of fast saliency map generation and the efficient method of target region segmentation. FT-LAB is first improved to adapt to embedded system-based saliency detection to detect the vehicle’s area of interest under UAV aerial video better. ...
... After the saliency map is extracted, a target segmentation method is needed to determine the position of the target in the image. The simplest and most common method is the threshold segmentation method, that is, set a fixed threshold. According to [28], the threshold is set to 100 for binary image segmentation. The method has the advantages of simple implementation and fast running speed. However, this method relies too much on prior knowledge and is not adaptive.The basic principle of the target segmentation algorithm based on the Booleanmaps [27] is to set several thresholds of the threshold segmentation method according to a certain interval. The interval set in [27] is 8, that is, the segmentation threshold is respectively set as 8, 16, 24, , 256. Then, a series of binary images are obtained to form a pool of target regionsof interest. Then, according to the principle that the target’s grayscale value is more stable than the background's, the number of times that the target appears in a certain position in the image is greater than a certain threshold to determine the target regions, and it is finally combined with OTSU[30] to determine the final target area.The method can extract the target of simple background effectively, but because of the need to deal with a large number of different binary images, the method of processing speed is slow; processing a frame takes about 27s (resolution 960 ). ...
... ] is to set several thresholds of the threshold segmentation method according to a certain interval. The interval set in [27] is 8, that is, the segmentation threshold is respectively set as 8, 16, 24, , 256. Then, a series of binary images are obtained to form a pool of target regionsof interest. Then, according to the principle that the target’s grayscale value is more stable than the background's, the number of times that the target appears in a certain position in the image is greater than a certain threshold to determine the target regions, and it is finally combined with OTSU[30] to determine the final target area.The method can extract the target of simple background effectively, but because of the need to deal with a large number of different binary images, the method of processing speed is slow; processing a frame takes about 27s (resolution 960 ). ...
... Where is the symmetry value of thetarget. is the information entropy, which is also the mathematicalexpectation of information content. is the max value ofinformation entropy.Inspired by[27], five definitions used for measuring region similarity between two labelled regions i and j are defined as follows: ...
“Frequency-Tuned Salient Region Detection,”
8
2009
... In recent years, a large number of saliency detection methods have emerged. Figure 1 illustrates comparison results between state-of-the-art saliency detection algorithms that are processed on the data set in the experiment section of this paper: (a) is the original image, (b) is the grayscale image of (a), (c) is the ground truth, (d-n) are the respective saliency map results of AC [20], RC [21], HC [22], LC [23], IM [24], SUN and SUN-CON [25], IT [26], SaliencyMap [27], and FT-LAB and FT-L [28], which are processed on Frame #70 of testvideo1 (video resolution: 960×540) in our data set. Experimental results show that the AC, RC, LC, HC, and IT methods can quickly detect the target region in the image. However, as can be seen from Figure 1 (d), (e), (f), and (g), except for the target, the saliency eigenvalues are relatively close to a large number of interference regions; therefore, the subsequent segmentation algorithm will split out more interference regions. It can be seen from Figure 1 (h), (i), and (j) that the detection results of IM, SUN, and SUN-CON are quite satisfactory; however, the processing times of these three algorithms all exceed 2900ms. The algorithm has high complexity and cannot be applied to real-time detection system. The principle of the Saliency Map and FT-LAB are roughly the same; however, since FT-LAB performs Gaussian smoothing on the L, A, and B components of the LAB color space of the image, the complexity of the algorithm is relatively high. If the FT-LAB is reduced and only the L channel is processed, the processing result of the algorithm is shown in Figure 1 (a). It is almost the same as FT-LAB, and the processing speed of the algorithm is shortened by half. Although the processing speed is improved, the processing speed of 858 ms/framestill bcannot meet the engineering requirements. Therefore, inspired by the FT-LAB algorithm, a fast region-of-interest extraction method based on saliency region detection is presented in this paper. The method includes two main parts: the method of fast saliency map generation and the efficient method of target region segmentation. FT-LAB is first improved to adapt to embedded system-based saliency detection to detect the vehicle’s area of interest under UAV aerial video better. ...
... The average of the L, a,and b components of the whole imagelavg, aavg, and bavgare calculated firstly, and then slvec, savec, and sbvec areobtained by filtering the L, a, and b components using the difference of Gaussian (DoG) filter proposed in [28]. ...
... For an integer , it is simply the difference of two Gaussians whose standard deviations can have any ratio .We follow the parameter selection section of [28] to set the parameter of theDoGfilter. Inspired by [28],the saliency map Sap for a grayscaleimage can be formulated as: ...
... filter. Inspired by [28],the saliency map Sap for a grayscaleimage can be formulated as: ...
... In Figure 2, (a) is the RGB test image of No. 5108 in the public test set, with a picture resolution of . (b) is the saliency map image of the FT algorithm, and the processing time is 452.17ms/frame. (c) is the result of our embedment of FT algorithm code[29]. The main modification is to change the vector variables in the original program to unsigned char * and double *, etc. We can see that the processing speed reached 50.76ms/frame shortened nearly tentimes. (d) is the result of processing using a look-up table generated using Equations (6), (7), and (8). The processing speed of the algorithm is reduced to 34.21ms/frame, which basically achieves the real-time processing under the condition of ensuring that the processing result of the algorithm is consistent with the original FT.In order to verify the processing effect of algorithms on the grayscale image, we also use the grayscale image data set to test the algorithms. (f) shows the saliency map result after reducing the algorithm in [28]; only the L component processed,and the processing speed of the algorithm is 177ms/frame. (g) is the saliency map result ifonly the L component is processed by our method, and the processing speed is reduced to 13.12 ms/frame. (h) is the result of using the look-up table generated by Equation (9), and the algorithm achieves a processing speed of 7.7ms/frame while ensuring the same processing result as FT. ...
... Saliency region detection results comparison between [28] and our methods 3. Target Region of Interest Segmentation Method
After the saliency map is extracted, a target segmentation method is needed to determine the position of the target in the image. The simplest and most common method is the threshold segmentation method, that is, set a fixed threshold. According to [28], the threshold is set to 100 for binary image segmentation. The method has the advantages of simple implementation and fast running speed. However, this method relies too much on prior knowledge and is not adaptive.The basic principle of the target segmentation algorithm based on the Booleanmaps [27] is to set several thresholds of the threshold segmentation method according to a certain interval. The interval set in [27] is 8, that is, the segmentation threshold is respectively set as 8, 16, 24, , 256. Then, a series of binary images are obtained to form a pool of target regionsof interest. Then, according to the principle that the target’s grayscale value is more stable than the background's, the number of times that the target appears in a certain position in the image is greater than a certain threshold to determine the target regions, and it is finally combined with OTSU[30] to determine the final target area.The method can extract the target of simple background effectively, but because of the need to deal with a large number of different binary images, the method of processing speed is slow; processing a frame takes about 27s (resolution 960 ). ...
... After the saliency map is extracted, a target segmentation method is needed to determine the position of the target in the image. The simplest and most common method is the threshold segmentation method, that is, set a fixed threshold. According to [28], the threshold is set to 100 for binary image segmentation. The method has the advantages of simple implementation and fast running speed. However, this method relies too much on prior knowledge and is not adaptive.The basic principle of the target segmentation algorithm based on the Booleanmaps [27] is to set several thresholds of the threshold segmentation method according to a certain interval. The interval set in [27] is 8, that is, the segmentation threshold is respectively set as 8, 16, 24, , 256. Then, a series of binary images are obtained to form a pool of target regionsof interest. Then, according to the principle that the target’s grayscale value is more stable than the background's, the number of times that the target appears in a certain position in the image is greater than a certain threshold to determine the target regions, and it is finally combined with OTSU[30] to determine the final target area.The method can extract the target of simple background effectively, but because of the need to deal with a large number of different binary images, the method of processing speed is slow; processing a frame takes about 27s (resolution 960 ). ...
... An adaptive threshold target segmentation method based on mean-shift is proposedby [28]. The mean-shift segmentation algorithm that is performed in Lab color space provides better segmentation boundaries. Instead of applying a fixed threshold, an adaptive threshold that is image saliency dependent is also presented in their method to segment each image in their database. ...
“Saliency_Map_Comparison,”
2
2009
... In Figure 2, (a) is the RGB test image of No. 5108 in the public test set, with a picture resolution of . (b) is the saliency map image of the FT algorithm, and the processing time is 452.17ms/frame. (c) is the result of our embedment of FT algorithm code[29]. The main modification is to change the vector variables in the original program to unsigned char * and double *, etc. We can see that the processing speed reached 50.76ms/frame shortened nearly tentimes. (d) is the result of processing using a look-up table generated using Equations (6), (7), and (8). The processing speed of the algorithm is reduced to 34.21ms/frame, which basically achieves the real-time processing under the condition of ensuring that the processing result of the algorithm is consistent with the original FT.In order to verify the processing effect of algorithms on the grayscale image, we also use the grayscale image data set to test the algorithms. (f) shows the saliency map result after reducing the algorithm in [28]; only the L component processed,and the processing speed of the algorithm is 177ms/frame. (g) is the saliency map result ifonly the L component is processed by our method, and the processing speed is reduced to 13.12 ms/frame. (h) is the result of using the look-up table generated by Equation (9), and the algorithm achieves a processing speed of 7.7ms/frame while ensuring the same processing result as FT. ...
... To evaluate the effectiveness of our method, the FT+Mean-shift based algorithm and the UAV vehicle detection methods based on projection frame different(PFD) were compared. The source code of FT+Mean-shift was used for comparison,and it can be downloaded from their websites[29]. The general process of PFD is as follows: firstly, the projection match values of horizontal and vertical direction arecalculated, and the offsets of horizontal and vertical direction between adjacent frames are generated. Then, the frame different method is applied to detection the motion objects. Finally, the OTSU method is used to segment the vehicle in the image. The comparison results of three algorithms are shown in Figure 7, and the comparison of theCorrectness, Completeness, and Quality indicators for each of the three algorithms is illustrated in Table 2. ...
“A Threshold Selection Method from Gray-Level Histograms,”
1
1979
... After the saliency map is extracted, a target segmentation method is needed to determine the position of the target in the image. The simplest and most common method is the threshold segmentation method, that is, set a fixed threshold. According to [28], the threshold is set to 100 for binary image segmentation. The method has the advantages of simple implementation and fast running speed. However, this method relies too much on prior knowledge and is not adaptive.The basic principle of the target segmentation algorithm based on the Booleanmaps [27] is to set several thresholds of the threshold segmentation method according to a certain interval. The interval set in [27] is 8, that is, the segmentation threshold is respectively set as 8, 16, 24, , 256. Then, a series of binary images are obtained to form a pool of target regionsof interest. Then, according to the principle that the target’s grayscale value is more stable than the background's, the number of times that the target appears in a certain position in the image is greater than a certain threshold to determine the target regions, and it is finally combined with OTSU[30] to determine the final target area.The method can extract the target of simple background effectively, but because of the need to deal with a large number of different binary images, the method of processing speed is slow; processing a frame takes about 27s (resolution 960 ). ...
“Saliency Detection: A Spectral Residual Approach, ”
1
2007
... As shown in Figure 3, (a) is the result of Boolean maps. (b) is the result of mean-shift combined with setting segmentation method threshold to two times themean saliency of a given image. (c) is the result of original OTSU. (d),(e), and(f) are the results of [31] with different segmentation thresholds, whichare set to 2, 4, and 6 times themean saliency respectively. (g),(h),and (i) are the results from the OTSU method combined withHou's method using different thresholds. ...
“Multifeature Fusion Vehicle Detection Algorithm based on Choquet Integral,”
1
2014
... symmetryis a statistic to describe the symmetry of vehicles thatare obviously symmetrical objects. According to the symmetry-based methoddescribed in our previous work[32], thesymmetry measure methodbased on normalized entropy is applied to calculate the symmetry valueof ROIs. The symmetry is describedas Equation (14): ...


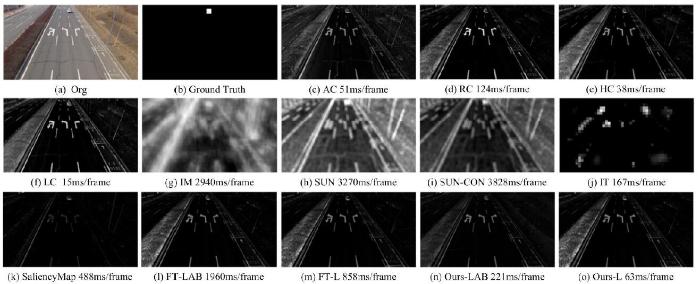
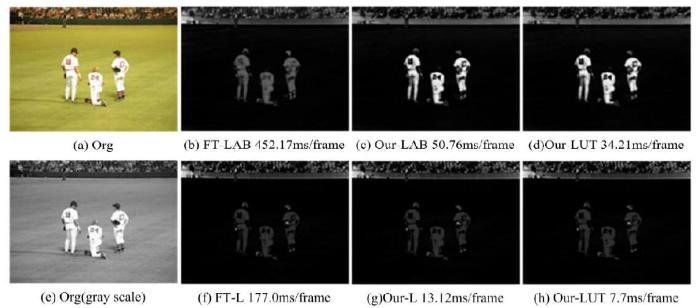
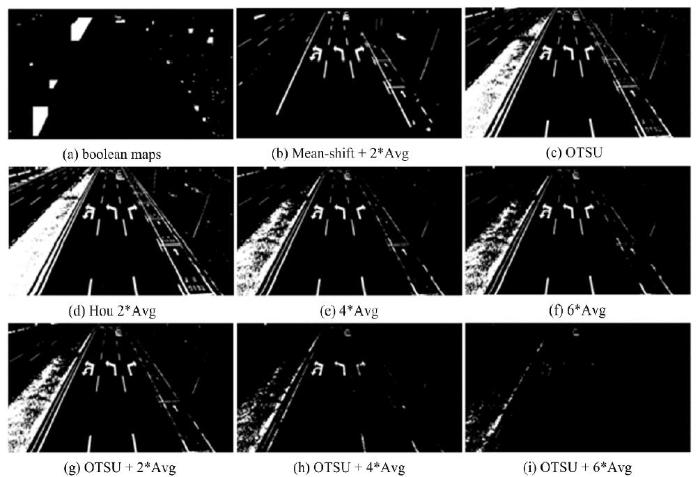
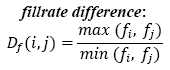
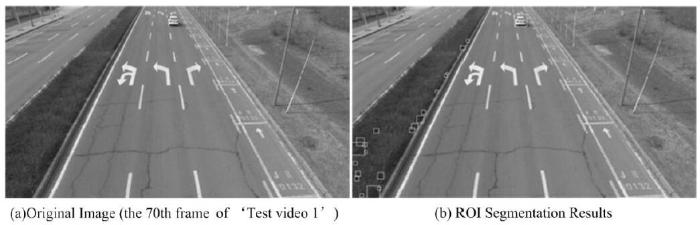
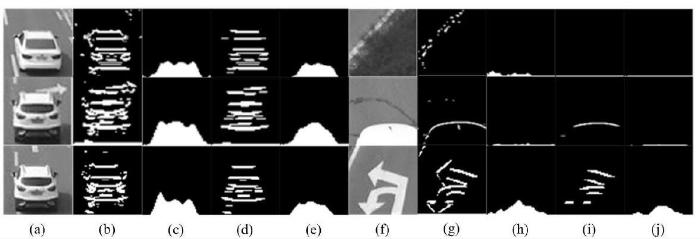
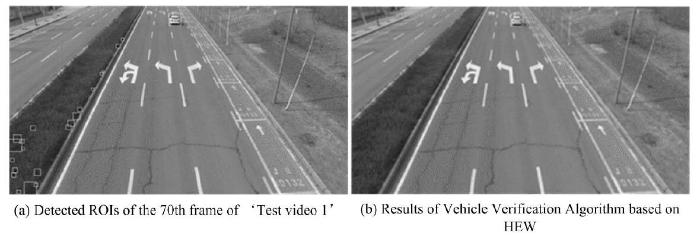
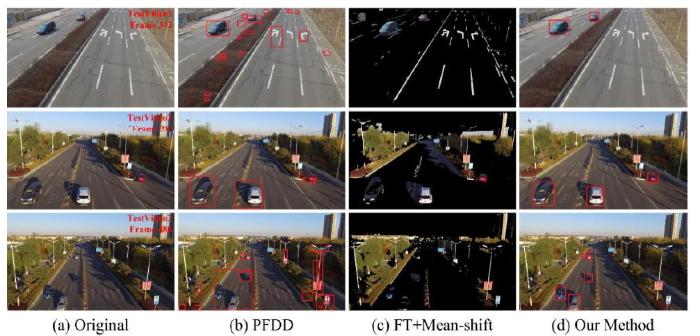

