


1. Introduction
Software testing, which is an important part of software engineering, aims at finding the errors and defects existing in the tested software. Besides, it is not only a vital stage to ensure the quality of software, but also the verification measure to ensure the consistency of software products and software requirements.
Automatic test case generation produces test cases automatically to meet the conditions based on the given test objectives; path coverage is necessary in the process of generating test cases. However, in some procedures, there are several infeasible paths, which cannot be covered using test data. In order to ensure the safety and feasibility of the program, it is necessary to solve the problem about infeasible path and take the corresponding measures in the experiment of generating test cases.
About infeasible path, there are two common methods at present. One method is to make some constraints by presetting a series of thresholds, such as the maximum coverage time, the number of iterations, and so on. If the threshold is exceeded in the path coverage process, the path to be covered is proved to be unreachable. In other words, this method cannot find the unreachable path directly, but only by setting the trigger condition in the experiment. Another method is to check the unreachable path by detecting the branch correlation of the target program. However, due to the limitations of the conditional predicates, the rate of path coverage is relatively low. There are some advantages and disadvantages in the above two methods. To some extent, both of them can detect the unreachable paths, but the rate of path coverage is not high. Therefore, some research has been done to better detect the unreachable paths and improve the rate of path coverage.
X. J. Yao 13 proposed a method of detecting unreachable paths based on conditional correlation, which can detect
unreachable paths and cover most or all of the paths. On the premise of unreachable path detection method based on conditional correlation, C. Y. Xia, et al. [12] proposed a path coverage method based on node probability, which was based on conditional statement-dependent unreachable path detection method. That is to say, the method proposed in [12] is an extension of that in [13]. To be specific, after detecting the unreachable path, the rate of node coverage on the complement set of unreachable paths, which acts as the basis for elimination of individual populations in GA, is calculated. In fact, GA, which can search for the optimal solution by simulating the biological evolution process, is widely used in software testing and has an excellent effect in test case generation. In [12], the fitness function is designed by combining the traditional layer proximity and branch distance in GA, which does not highlight the depth of nested conditional statements in the tested program and the difficulty difference when conditional statements are executed. Therefore, it is obvious that the efficiency and accuracy of test case generation need to be further improved.
As the main part of software testing, research on test case generation has been carried out for many years. With the advent of the era of big data, the demand for software is increasingly different, which makes scalability the inevitable choice for most systems. In fact, many plug-in technologies have been put into practice. For example, Firefox browser, Maven construction manager in Apache and Eclipse plug-in platform are integrated with a variety of commonly used functions. Therein, Eclipse is one of the most representative cases and it builds an environment in rich client platform that contributes to developing the application based on plug-ins. Besides, owing to the integration of many plug-ins, Eclipse is provided with good scalability, which makes it become a great plug-in development platform. Therefore, Eclipse will be employed as plug-in development platform in this work. In addition, because plug-in is a way to extend software functionality, it has a lot of excellent features. For example, it can adjust the functional structure of the plug-in framework by adding and removing corresponding plug-ins when running. The plug-in framework or plug-in architecture can be enriched by combining several plug-ins. Besides, the kernel of plug-in is very small, which makes it easy to remove and add the appropriate plug-ins according to different cases in system testing.
Because the node probability coverage can estimate the probability of nodes appearing in unreachable paths, the path coverage method based on contact layer proximity is proposed by introducing the concept of node probability coverage into GA and designing the corresponding fitness function in this work. Moreover, to improve the efficiency of generating test cases that meet requirements, contact vector is used to measure each node on the path to highlight the weight value of node in the internal program statements. Finally, a plug-in based on the proposed test case generation method, which can automatically generate test cases with specified target paths, is developed.
2. Related work
GA is a heuristic algorithm widely used in generating test data. According to [4], in regression testing, the key factor influencing the generation efficiency of test data in GA is how to initialize the population using the existing data; a regression test data generation method is proposed. In fact, a large amount of time needs to be consumed in the whole process of the GA, which includes inputting data, executing the tested program and calculating the fitness value of the individual. Therefore, in order to avoid this situation, the path coverage testing method based on neural network is proposed in [14]. The sample is used to train the neural network by which the fitness value of the individual is calculated in order to reduce the execution time in GA. Besides, the traditional regression testing method easily generates redundant data, which leads to low efficiency. Therefore, a multi-objective optimization model based on GA is constructed to quickly generate test data in [11].
In the above studies, GA plays an important role. However, as a simulated evolutionary algorithm, GA has some shortcomings in performance when it is applied alone. Therefore, it is necessary to combine it with other methods.
Test case generation is a very important stage in software testing. W. U. Chuan, et al. [3] proposed a method based on path correlation to solve regression testing. Besides, it is expensive to conduct mutation analysis testing. Therefore, G. J. Zhang, et al. [15] proposed a new method of test case generation based on weak mutation analysis. S. J. Jiang, et al. [9] proposed a test case generation method based on pattern combination particle swarm optimization, which can solve the problem that existing fitness functions may not be able to, such as evaluate all branch problems for some special programs (those programs containing nested, non-structured jumps, etc.).
Those methods in refs. [3,9,15] can solve some problems in software testing. However, there are several shortcomings. It is necessary to sort the target paths when solving regression test data using the method in [3], which leads to huge computational complexity. The variation branch is integrated into the original program in [15], which will not only cause structural changes in the program, but also make the source program more bloated. The authors in [9] proposed a solution to the problem that some specific structures cannot be covered in the program, but the processing is complex and the
calculation process has too many steps. The above test case generation methods do not take into account the difficulty difference of statement execution, and all the program statements are processed together. The efficiency of test case generation still needs to be improved.
In addition, path coverage is a kind of a typical research problem. The coverage of unreachable paths is always challenging, and there are many studies on how to identify and cover all reachable paths. According to detection method based on conditional statement correlation for unreachable path, C. Y. Xia, et al. [12] proposed an automatic test case generation strategy based on node probability coverage. However, it still has shortcomings that all program statements are regarded as the same path nodes.
D. Beyer, et al. [2] developed a plug-in BLAST for model detection based on Eclipse, and it can verify and analyse some problems such as assertion checking and reachability analysis, dead code analysis and test generation problems. H. V. Nguyen, et al. [10] analysed plug-in conflicts existing in the configuration plug-in environment, and dealt with the problem of plug-ins executing each other by sharing configuration plug-ins. Specifically speaking, different plug-ins are combined and the duplicated parts are executed once, which can effectively avoid the problem of reducing the efficiency and the plug-in conflicts when the same content is loaded repeatedly. Most of the existing plug-in frameworks are aimed at single user client applications and do not support the users’ own plug-in extensions. Therefore, M. Jahn, et al. [8] proposed and described a plug-in framework (Plux.NET), which is a multi-user plug-in framework. And the end user can extend the application through the server and the client. A self-organization mechanism for plug-ins is proposed to orderly manage plug-ins and some defects in the current self-organizing linear menu structure are described in [1]. A hierarchical structure-based management is designed to provide convenient and fast management of a large number of plug-ins that cannot be dealt with by the previous linear structure. In order to make plug-in systems easy to understand, some testers and developers were interviewed in ref. [6]. Through their interviews, the impact of plug-ins in the testing process and some obstacles in integrated testing are summarized, and some suggestions and future research areas are summarized. Because there is lack of some research on the possible configuration combinations between plug-in tools and components in current testing tools, the methods in refs. [5,7] proposed a set of architecture view solutions.
The above studies on plug-in are mostly employed to solve plug-in management and conflict problems, and there is not much narrative about the construction of plug-in. The test case generation method is presented and a plug-in for the generation of test cases is developed in this work.
3. The path coverage method based on contact layer proximity
In this section, a path coverage method based on contact layer proximity is proposed. It combines with node probability coverage to design the fitness function in GA to quickly generate test cases and get the optimal solution. Specifically speaking, in the path coverage method based on contact layer proximity, contact vector and path vector are used for inner product operation at first. Then, the similarity probability of the inner product between the target paths, which can be used to judge whether the target path has been successfully covered, is calculated. In addition, due to the unreachable paths, the probability coverage method is employed to detect the unreachable path.
3.1. Related definitions
Definition 1 (Control Flow Graph, CFG). CFG is a graphical representation of program structure. A 4-tuple G = (D, E, st, ed) is used to represent CFG, where D denotes the node set, di is the node in D, and E is the edge set, eij = (di, dj) ∈E indicates the path from di to dj, namely the edge in G. Besides, st and ed express start node and end node in CFG, respectively. Generally speaking, a control flow graph is composed of nodes and edges. Therein, decision statement is regarded as a node, and an edge is formed between two nodes.
Figure 1 is an example of a triangle-classifying program and its CFG. Note that, for the convenience of discussion, each statement in the program corresponds to a node in CFG.
Definition 2 (Path). A path is a sequence made up of a series of nodes di(i = 1, 2, … , n). For example, R = <st, d1, d2, d3, …, dn, ed> represents a path, where di∈D and each edge corresponding to the nodes of path belongs to E.
st public static void triangle(int a, int b, int c){
Figure 1.
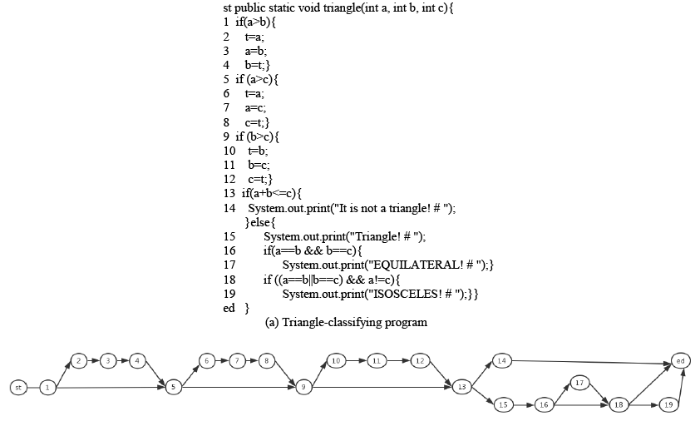
Figure 1.
A program instance and its control flow graph
Then, the method to determine the cut node is introduced. To start with, hit random variable hij is defined as follows:
The hit random variable is used to represent the execution state of each component of each vector in the nodes of each tested program. Therefore, m groups of input vectors sequentially execute the tested program and m groups of running results are obtained to form m*n hit matrix M:
And the probability that node dj is hit through is defined as follows:
where n is the total number in the path and m is the total number of input vectors. It is worth noting that node dj represents cut node when p =1 and vice versa.
Definition 4 (Reachability and Unreachability). If there is a path R(x) = r after running a set of inputs x, then the path r is reachable. Otherwise, r is unreachable.
Suppose di and dj are two decisions. If they satisfy the true-true (or true-false) relationship, then any path including the true-branch of di and the false-branch (or true-branch) of dj is unreachable; if they satisfy the false-true (or false-false) relationship, then any path including the false-branch of di and the false-branch (or true-branch) of di is also unreachable [13]. That’s to say, the paths containing any exclusive conditions are unreachable.
3.2. The process of test case generation
The test case generation method is divided into two parts. Firstly, the node probability path coverage method is used to detect the probability of the individuals in the unreachable path. Secondly, the contact layer proximity (cf. Definition 5 and formula (6) for detailed explanation) is utilized as the basis for judging the coverage of the target path.
The individual x is used as a set of inputs to execute the tested program $\phi$ that has $\tilde{n}$ nodes. In order to optimize calculation and avoid meaningless calculation, the cut node, entrance node and exit node need to be removed. From the property of cut node, it will be traversed for all the test input data. Therefore, the total number of remaining nodes is $n (n \leq \tilde{n})$ by simplified calculation when cut node is removed, and the traversed degree of individual x is defined as follows: φ
where $ p(d_{j}|\bar{\phi})$ represents the probability of node $d_j$ appearing in the unreachable path, $p(d_{j}|\bar{\phi})$ denotes the probability of node $d_j$ appearing in the path , and $aim_j$ indicates whether the node $d_j$ is a node in the destination path or not. $aim_j$ is defined as follows:
where $p(d_{j}|\bar{\phi})$ is the target path. The process of computing node probability in unreachable path and traversed degree of individual x is shown in Example 1.
Example 1. In Figure 1, supposing that the target path Raim is < st, $d_1$, $d_2$, $d_3$, $d_4$, $d_5$,$d_9$, $d_{13}$ , $d_{15}$, $d_{16}$, $d_{18}$, ed >, and the current path R is <st, $d_1$, $d_2$, $d_3$, $d_4$, $d_5$, $d_6$, $d_7$, $d_8$, $d_9$, $d_{10}$, $d_{11}$, $d_{12}$, $d_{13}$, $d_{14}$, ed> generated by executing a test case, it is obvious that only nodes $d_1$, $d_2$, $d_3$, $d_4$, $d_5$,$d_9$, $d_{13}$ are in both R and Raim and aimj=1 for these nodes. In addition, for d1, d5, d9, d13 are cut nodes, traversed degree of R and node probability in the unreachable path are calculated only considering the nodes d2, d3, d4. Therefore, according to the unreachable paths in Table 1, we can get the node probability in the unreachable paths by formula (4), and the concrete data is as follows:
$p(d_{2}|\bar{\phi})=\frac{12}{22}, p(d_{3}|\bar{\phi})=\frac{12}{22}, p(d_{4}|\bar{\phi})=\frac{12}{22}$
And the traversed degree of R is the sum of the node probabilities in the unreachable paths. The specific data is as follows:
$P_{(R)}= p(d_{2}|\bar{\phi})+ p(d_{3}|\bar{\phi})+ p(d_{4}|\bar{\phi})=\frac{18}{11}$
From formula (4), we can know that the current unreachable path needs to be obtained before calculating the individual traversed degree. The traversed degree of input individual can be found by calculating the probability of the current effective node appearing in the unreachable path set.
In this work, GA is used to generate test cases and the process of generating test cases is illustrated as follows.
1) Population initialization
It is necessary to encode the individuals and set the length of the chromosome before using GA. The binary coding format is utilized and the length L of the individual chromosome is set according to the range of the input data of the test case. The individuals are generated according to the number of population set in advance. A common case is used to illustrate the process of population encoding in the following.
Suppose the tested program requires two input parameters and their values range from 1 to 100. It is necessary to set up two parameters when encoding chromosome. Assume that the binary form of each parameter is a string consisting of 0 or 1and its length equals to 7. Then the final encoding form of chromosome is binary string whose length equals to 14.
2) Fitness function
The node probability is a part of the fitness function when designing fitness function. A path coverage method based on contact layer proximity is proposed according to the different execution difficulty of conditional statements in tested program. At first, a weight factor for the path coverage is achieved by quantifying the difficulty of execution of each conditional statement in order to highlight the execution characteristics of each node in the path. Before describing the contact layer proximity method, it is necessary to introduce contact vector, whose definition is shown in Definition 5.
Definition 5 (Contact Vector). Given path $R=\le \tau_{1}, \tau_{2}, \tau_{3}, \cdots, \tau_{n} \ge$, the contact vector ρ is an n-dimensional vector corresponding to the path R, and the component ρi (i = 1, 2, …, n) of the contact vector represents the contact degree of the ith node of the path R. Encoding is conducted from the outer layer to the inner layer, and the contact degree of the outermost nodes is set to 1.
As shown in Figure 1 (a), node 1 is the outermost layer. Therefore, its contact degree is set to 1 while the contact degree of node 2 is set to 2; this is because node 2 is much difficult to contact than node 1. Then, following the rules, the contact degree of other nodes is arranged. As a result, the contact vector is a sequence of contact degrees formed by the contact degree of a series of nodes in the path.
The contact layer proximity γ represents the ratio of the inner product of the current path vector and contact vector to the inner product of trajectory vector in the target path and corresponding contact vector. And the concrete formula is shown in formula (6).
where $R_aim$ denotes the target path, $ r_{i}$ and $ r_{j}$ represent the ith and jth node vectors of the current path respectively, $\rho_i$ and $\rho_j$ are the contact degrees of the ith and jth nodes respectively, and di is the ith node in target path corresponding to the current path.
The process of computing the contact layer proximity is shown in Example 2.
Example 2. In Figure 1, supposing that the target path is designed with a = 80, b = 20 and c = 90, we can get Raim=<st, $d_1$, $d_2$, $d_3$, $d_4$, $d_5$, $d_9$, $d_13$ , $d_15$, $d_16$, $d_18$, ed>. Then, the contact layer proximity of the generated path R=<st, $d_2$, $d_3$, $d_4$, $d_5$, $d_6$, $d_7$, $d_8$, $d_9$, $d_{10}$, $d_{11}$, $d_{12}$, $d_{13}$, $d_{14}$, ed> is computed as follows. At first, the contact vector C=[1, 2, 2, 2, 1, 2, 2, 2, 1, 2, 2, 2, 1, 2, 2, 2, 3, 2, 3] is obtained according to Definition 5. Note that the target path Raim includes those nodes d1, d2, d3, d4, d5, d9, d13, which are also in R. Then, the node vectors of these nodes and their corresponding components in C are weighted and summed to act as the numerator in formula (6), namely 1*1+1*2+1*2+1*2+1*1+1*1+1*1=10. And, the trajectory vectors of all the nodes in the target path Raim and their corresponding components in the contact vector C are weighted and summed to get the denominator in formula (6), namely 1*1+1*2+1*2+1*2+1*1+1*1+1*1+1*2+1*2+1*2=16. Finally, we can obtain the contact layer proximity $\gamma_{(R)}=10/16$ of R.
The contact layer proximity $\gamma_{(x)}$ is used as the weight of the fitness function. Combining the traversed degree P(x) of the path, the fitness function is constructed as follows: γ
where Nc represents the number of conditional branches that the target path covers, nc represents the number of the same conditional branches that both the current path and the target path cover.
3) Selection
Selection operation is to choose an excellent individual with higher fitness, and the selection process is as follows. First, the optimal individual of the initial population is preserved as the first individual of the next generation of evolutionary populations. Then, other individuals become better individuals by crossover operation. Specifically speaking, some individuals are randomly selected from the original population and are divided into two groups. Then, the fitness values of individuals in each group are calculated separately. As a result, the two optimal individuals are obtained.
4) Crossover
Crossover operation is to allow the new individual to have a better fitness value. When doing crossover operation, the gene selection is not arbitrary, but related with the crossover probability. The crossover process is performed aiming at genes in chromosome. The specific crossover rules include the following steps. First, the initial value of a chromosome is selected as a new individual by randomly selecting chromosomes from two individuals. Then, the number of crossover genes is the product of crossing rate and chromosome length len. Next, the position of the gene to be exchanged is determined by the generated random number. Len exchanges between the two genes are carried out after crossover position is determined. It is worth noting that the random number is generated again to perform the gene exchange operation if the crossover position occurs repeatedly.
5) Mutation
Mutation operation is to change the values of some genes of the loci in an individual chromosome coding strand. A new individual is gotten by replacing with the other alleles of the locus. The degree of mutation is controlled by the mutation rate. The specific mutation process is as follows.
First, the genes on individual chromosomes are traversed, and the mutation process is handled in each iteration. For the ith mutation operation, a random number is first generated, and it is compared with the mutation rate. When the random number is greater than the mutation rate, the mutation operation is performed. Then, a random number will be generated again; the result is set as the genetic value for the mutation operation. Besides, the value is assigned to the ith position of the genes in the individual chromosome to be manipulated.
After performing the operations of selection, crossover and mutation, a more excellent individual will be gotten. The optimal individual satisfying the fitness function is finally obtained through iterative population optimization. The detailed steps are shown as algorithm 1 in Figure 2.
Figure 2. Test case generation algorithm
| Algorithm 1. Test case generation algorithm |
| Step 1. Apply the method of program instrumentation to preprocess the program tested; |
| Step 2. Execute the m groups of test cases to generate the hit matrix M, detect unreachable paths and determine cut nodes; |
| Step 3. Initialize Population; |
| Step 4. Encode the individual, and execute the modified program to compute the fitness function value; |
| Step 5. Determine whether the fitness value of the individual is greater than or equal to the fitness value of the target path: if so, go to step 8; |
| Step 6. Confirm whether the maximum number of iterations is reached: if so, go to step 8; |
| Step 7. Conduct the selection, crossover and mutation of population to generate progeny population, and then go to step 4; |
| Step 8. Stop population evolution, preserve evolutionary individuals and decode output data. |
4. Experimental comparison and analysis
In order to verify the effectiveness of the proposed method, two classical benchmark programs, namely triangle-classifying and bubble sorting, are used as the tested programs in experiment. The experimental results are utilized to illustrate the effect of this method. To make comparing these similar methods easier, the same parameters including the parameter of crossover rate and mutation rate are set to compare the results of the proposed method and that in [12].
4.1. Accuracy verification of path coverage
In order to validate that using the method mentioned above can accurately cover the target path, a triangle-classifying benchmark program (as shown in Figure 1(a)) will be used as a verification program in this section. Because the triangle-classifying program is simple and does not contain a loop structure, it helps to show the details of the experiment and the results. The specific experimental procedure is as follows.
Table 1 The unreachable paths in triangle-classifying program
| Path list |
|---|
| R1=<st, $d_{1}$, $d_{2}$, $d_{3}$, $d_{4}$, $d_{5}$, $d_{6}$, $d_{7}$, $d_{8}$, $d_{9}$, $d_{10}$, $d_{11}$, $d_{12}$, d13 , $d_{15}$, $d_{16}$, $d_{17}$, $d_{18}$, $d_{19}$,ed> |
| R2=<st, $d_{1}$, $d_{2}$, $d_{3}$, $d_{4}$, $d_{5}$, $d_{6}$, $d_{7}$, $d_{8}$, $d_{9}$, $d_{13}$, $d_{15}$, $d_{16}$, $d_{17}$, $d_{18}$, $d_{19}$, ed> |
| R3=<st, $d_{1}$, $d_{2}$, $d_{3}$, $d_{4}$, $d_{5}$, $d_{9}$, $d_{10}$, $d_{11}$, $d_{12}$, $d_{13}$, $d_{15}$, $d_{16}$, $d_{17}$, $d_{18}$, $d_{19}$, ed> |
| R4=<st, $d_{1}$, $d_{2}$, $d_{3}$, $d_{4}$, $d_{5}$, $d_{9}$, $d_{13}$, $d_{15}$, $d_{16}$, $d_{17}$, $d_{18}$, $d_{19}$, ed> |
| R5=<st, $d_{1}$, $d_{5}$, $d_{6}$, $d_{7}$, $d_{8}$, $d_{9}$, $d_{10}$, $d_{11}$, $d_{12}$, $d_{13}$, $d_{15}$, $d_{16}$, $d_{17}$, $d_{18}$, $d_{19}$, ed> |
| R6=<st, $d_{1}$, $d_{5}$, $d_{6}$, $d_{7}$, $d_{8}$, $d_{9}$, $d_{13}$, $d_{15}$, $d_{16}$, $d_{17}$, $d_{18}$, $d_{19}$, ed> |
| R7=<st, $d_{1}$, $d_{5}$, $d_{9}$, $d_{10}$, $d_{11}$, $d_{12}$, $d_{13}$, $d_{15}$, $d_{16}$, $d_{17}$, $d_{18}$, $d_{19}$, ed> |
| R8=<st, $d_{1}$, $d_{5}$, $d_{9}$, $d_{13}$, $d_{15}$, $d_{16}$, $d_{17}$, $d_{18}$, $d_{19}$, ed> |
| R9=<st, $d_{1}$, $d_{2}$, $d_{3}$, $d_{4}$, $d_{5}$, $d_{6}$, $d_{7}$, $d_{8}$, $d_{9}$, $d_{13}$, $d_{14}$, ed> |
| R10=<st, $d_{1}$, $d_{2}$, $d_{3}$, $d_{4}$, $d_{5}$, $d_{6}$, $d_{7}$, $d_{8}$, $d_{9}$, $d_{13}$, $d_{15}$, $d_{16}$, $d_{18}$, $d_{19}$, ed> |
| R11=<st, $d_{1}$, $d_{2}$, $d_{3}$, $d_{4}$, $d_{5}$, $d_{6}$, $d_{7}$, $d_{8}$, $d_{9}$, $d_{13}$, $d_{15}$, $d_{16}$, $d_{17}$, $d_{18}$, ed> |
| R12=<st, $d_{1}$, $d_{2}$, $d_{3}$, $d_{4}$, $d_{5}$, $d_{6}$, $d_{7}$, $d_{8}$, $d_{9}$, $d_{13}$, $d_{15}$, $d_{16}$, $d_{18}$, ed> |
| R13=<st, $d_{1}$, $d_{2}$, $d_{3}$, $d_{4}$, $d_{5}$, $d_{6}$, $d_{7}$, $d_{8}$, $d_{9}$, $d_{10}$, $d_{11}$, $d_{12}$, $d_{13}$, $d_{15}$, $d_{16}$, $d_{17}$, $d_{18}$, ed> |
| R14=<st, $d_{1}$, $d_{2}$, $d_{3}$, $d_{4}$, $d_{5}$, $d_{9}$, $d_{10}$, $d_{11}$, $d_{12}$, $d_{13}$, $d_{15}$, $d_{16}$, $d_{17}$, $d_{18}$, ed> |
| R15=<st, $d_{1}$, $d_{2}$, $d_{3}$, $d_{4}$, $d_{5}$, $d_{9}$, $d_{13}$, $d_{15}$, $d_{16}$, $d_{17}$, $d_{18}$, ed> |
| R16=<st, $d_{1}$, $d_{5}$, $d_{6}$, $d_{7}$, $d_{8}$, $d_{9}$, $d_{13}$, $d_{15}$, $d_{16}$, $d_{17}$, $d_{18}$, ed> |
| R17=<st, $d_{1}$, $d_{5}$, $d_{6}$, $d_{7}$, $d_{8}$, $d_{9}$, $d_{13}$, $d_{15}$, $d_{16}$, $d_{18}$, $d_{19}$, ed> |
| R18=<st, $d_{1}$, $d_{5}$, $d_{6}$, $d_{7}$, $d_{8}$, $d_{9}$, $d_{13}$, $d_{15}$, $d_{16}$, $d_{18}$, ed}> |
| R19=<st, $d_{1}$, $d_{5}$, $d_{6}$, $d_{7}$, $d_{8}$, $d_{9}$, $d_{10}$, $d_{11}$, $d_{12}$, $d_{13}$, $d_{15}$, $d_{16}$, $d_{17}$, $d_{18}$, ed> |
| R20=<st, $d_{1}$, $d_{5}$, $d_{9}$, $d_{10}$, $d_{11}$, $d_{12}$, $d_{13}$, $d_{15}$, $d_{16}$, $d_{17}$, $d_{18}$, ed> |
| R21=<st, $d_{1}$, $d_{2}$, $d_{3}$, $d_{4}$, $d_{5}$, $d_{6}$, $d_{7}$, $d_{8}$, $d_{9}$, $d_{13}$, $d_{15}$, $d_{16}$, $d_{18}$, $d_{19}$, ed> |
| R22=<st, $d_{1}$, $d_{5}$, $d_{6}$, $d_{7}$, $d_{8}$, $d_{9}$, $d_{10}$, $d_{11}$, $d_{12}$, $d_{13}$, $d_{15}$, $d_{16}$, $d_{18}$, $d_{19}$, ed> |
Step 2. 20 * 19 hit matrix M is gotten by running 20 test cases independently, and the probability of each node is obtained according to formula (3), the concrete results are shown in the following.
$P_{d_{1}}$=1, $P_{d_{2}}$=11/22, $P_{d_{3}}$=11/22, $P_{d_{4}}$=11/22, $P_{d_{5}}$=1, $P_{d_{6}}$=7/22, $P_{d_{7}}$=7/22, $P_{d_{8}}$ =7/22, $P_{d_{9}}$=1, $P_{d_{10}}$=14/22,
$P_{d_{11}}$=14/22, $P_{d_{12}}$=14/22, $P_{d_{13}}$=1, $P_{d_{14}}$=12/20, $P_{d_{15}}$=8/20, $P_{d_{16}}$=8/20, $P_{d_{17}}$=0, $P_{d_{18}}$=8/20, $P_{d_{19}}$=0
It can be seen that nodes d1, d5, d9, d13 are cut nodes.
Step 3. Test cases are automatically generated by GA. First, the individuals are encoded in binary form. Then, new population is generated by selection, crossover and mutation operation for the initial population. Finally, combining the unreachable path in Table 1, the traversed degrees of individuals are gotten by formula (4). The formula (7) calculating the fitness value of an individual is shown in the following.
Table 2 The coverage data of triangle-classifying program
| ID | Traversed degree | Fit(x) | Target fitness | Target path |
|---|---|---|---|---|
| 1 | 3.5455 | 4.8498 | 4.8498 | <st, $d_{1}$, $d_{5}$, $d_{9}$, $d_{13}$, $d_{15}$, $d_{16}$, $d_{17}$, $d_{18}$,ed> |
| 2 | 4.9545 | 6.7772 | 6.7772 | <st, $d_{1}$, $d_{2}$, $d_{3}$, $d_{4}$, $d_{5}$, $d_{6}$, $d_{7}$, $d_{8}$, $d_{9}$, $d_{10}$, $d_{11}$, $d_{12}$, $d_{13}$, $d_{14}$, ed> |
| 3 | 3.4091 | 4.6632 | 4.6632 | <st, $d_{1}$, $d_{5}$, $d_{9}$, $d_{13}$, $d_{15}$, $d_{16}$, $d_{18}$, $d_{19}$, ed> |
| 4 | 1.2727 | 1.7409 | 1.7409 | <st, $d_{1}$, $d_{5}$, $d_{9}$, $d_{10}$, $d_{11}$, $d_{12}$, $d_{13}$, $d_{14}$, ed> |
| 5 | 5.0455 | 6.9016 | 6.9016 | <st, $d_{1}$, $d_{2}$, $d_{3}$, $d_{4}$, $d_{5}$, $d_{9}$, $d_{13}$, $d_{15}$, $d_{16}$, $d_{18}$, $d_{19}$, ed> |
| 6 | 2.8636 | 3.9171 | 3.9171 | <st, $d_{1}$, $d_{5}$, $d_{9}$, $d_{13}$, $d_{15}$, $d_{16}$, $d_{18}$, ed> |
| 7 | 7.7727 | 10.6321 | 10.6321 | <st, $d_{1}$, $d_{2}$, $d_{3}$, $d_{4}$, $d_{5}$, $d_{6}$, $d_{7}$, $d_{8}$, $d_{9}$, $d_{10}$, $d_{11}$, $d_{12}$, $d_{13}$, $d_{15}$, $d_{16}$, $d_{18}$, ed> |
| 8 | 4.6364 | 6.3420 | 6.3420 | <st, $d_{1}$, $d_{5}$, $d_{9}$, $d_{10}$, $d_{11}$, $d_{12}$, $d_{13}$, $d_{15}$, $d_{16}$, $d_{18}$, $d_{19}$, ed> |
| 9 | 6.2727 | 8.5803 | 8.5803 | <st, $d_{1}$, $d_{2}$, $d_{3}$, $d_{4}$, $d_{5}$, $d_{9}$, $d_{10}$, $d_{11}$, $d_{12}$, $d_{13}$, $d_{15}$, $d_{16}$, $d_{18}$, $d_{19}$, ed> |
| 10 | 5.4545 | 7.4611 | 7.4611 | <st, $d_{1}$, $d_{5}$, $d_{6}$, $d_{7}$, $d_{8}$, $d_{9}$, $d_{13}$, $d_{15}$, $d_{16}$, $d_{18}$, $d_{19}$, ed> |
The range of experimental input parameters is [1, 1023], 10 representative target paths are randomly selected, and the experimental results are shown in Table 2.
Different test cases are applied to cover the same target path, and the results show that the value of fitness function
Fit(x) is the same as the target fitness value. In order to highlight the accuracy of coverage, 10 representative target paths are selected for experimentation, as seen from the experimental results in Table 2. For each target path, tests case that can satisfy the coverage condition can be generated. It reveals that the proposed method has a good performance for the coverage for target path.
4.2. Comparative analysis
In order to better verify the effectiveness of the proposed method, it is compared with similar methods, and the same experimental parameters as [12] are set. Specifically, the probabilities of crossover and mutation are set to 0.9 and 0.3 respectively. Besides, the values of input data range from 1 to 1023. The experiments using the proposed method both in this work and [12] are done 15 times, and the average running time is gotten.
Two benchmark programs (triangle-classifying program and bubble sort program) are adopted as the tested programs. First, the experiment about triangle-classifying program is used, and Raim =<st, $d_{1}$, $d_{2}$, $d_{3}$, $d_{4}$, $d_{5}$, $d_{6}$, $d_{7}$, $d_{8}$, $d_{9}$, $d_{10}$, $d_{11}$, $d_{12}$, d13 , $d_{15}$, $d_{16}$, $d_{17}$, $d_{18}$, ed> is selected as the target path. Therein, the specific experimental data are shown in Table 3.
Table 3 Comparison of triangle-classifying program
| Population size | |||||
|---|---|---|---|---|---|
| 50 | 100 | 150 | 200 | ||
| [12] | 0.00660s | 0.00467s | 0.00480s | 0.00620s | |
| The proposed method | 0.00427s | 0.00440s | 0.00420s | 0.00610s | |
| Time difference | 0.00233s | 0.00027s | 0.00060s | 0.00010s | |
In Table 3, the coverage for the target path Raim is divided into four cases, namely, the size of population is 50, 100, 150 and 200, respectively. The program using the proposed method in this work and [12] is performed to obtain the average time of covering the target path. In terms of population size, the execution time has no obvious regularity and fluctuates upward and downward. The reason is that GA is a heuristic algorithm, which is stochastic in population initialization and population evolution. Therefore, there is no way to interfere with the evolution process. For running time, we compare the execution time using the proposed method in this work with that in [12]. It is obvious that the execution time using the proposed method is less than that in [12]. As seen from the data in Table 3, when the size of population is 50, the time difference between the two methods is obvious. However, the gap between the two methods tends to be stable when the population size reaches 200, which shows that the efficiency of the proposed method is higher than that in [12]. Compared to similar methods, it can still maintain a higher efficiency with the gradually increasing population size.
The experiments with same configuration are performed on the bubble sorting program. First of all, the tested program is instrumented and then executed. The unreachable paths and cut nodes are gotten. Besides, the same experimental process is set as the triangle-classifying program, and the experiments are conducted using the proposed method in this work and ref. [12], respectively. The experimental data is gotten and the results are shown in Table 4.
Table 4 Comparison of bubble sorting program
| Population size | |||||
|---|---|---|---|---|---|
| 40 | 80 | 120 | 160 | 200 | |
| [12] | 0.0049s | 0.0048s | 0.00633s | 0.00760s | 0.00820s |
| The proposed method | 0.0042s | 0.0047s | 0.00606s | 0.00747s | 0.00813s |
| Time difference | 0.0007s | 0.0001s | 0.00027s | 0.00013s | 0.00007s |
In Table 4, the population size ranges from 40 to 200 and the interval is 40. Batch experiments are carried out in five cases. As far as time is concerned, when the proposed method in this work is applied, the time is less than that in [12] in five kinds of population size. For the variation trend of time difference, the time difference between them is 0.0007s when the population size is 40 while it is 0.0007s when the population size is 200. The variation trend of the time difference in the five cases shows that, compared with the method in [12], the efficiency using the proposed method is obviously improved when the population is small while efficiency is gradually stable when the population size is much larger. But anyway, it still has advantages compared to similar methods.
In summary, by analysing the experimental results of the two benchmarks, the proposed method in this work serves to improve the efficiency of generating test case, and it can maintain the advantages and stability for a number of benchmarking programs.
5. Implementation of test case plug-in
Plug-in, which serves to meet our increasing functional requirements, is an extension of software projects. There are a wide variety of plug-ins, including operating system-based plug-ins, browser-based plug-ins and plug-ins based on different languages, and so on. The development approach and architecture of plug-ins are different owing to the different types of supported platforms. In order to be easy to generate test cases using the proposed method in this work, it is necessary to implement a plug-in system. Therefore, based on the proposed method, a test case plug-in is developed. Besides, Eclipse is used as a development platform, and the plug-in project acts as a development approach. The XML file is employed to configure the functionality of plug-ins. Some related definitions are as follows.
Definition 6 (Plug-in Extension Point). The plug-in extension point is a mechanism for plug-ins to extend the functionality and allow other plug-ins to be extended in an extensible project.
There are about 40 different types of extension points in Eclipse. In this work, three extension points, namely command, handler and menu, are used. Command is the behavior extension point, which can declare a behavior operation. Handler is the implementation for specific behavior extension point, which is directly bound to the concrete function implementation class. Menu is the menu extension point, which defines the implement way of menu. The plug-in extension point is to implement specific operations by extending elements.
Definition 7 (Extension Point Element). An extension point element is a collection of properties that implements binding mapping between different types of extension points.
In fact, the binding between the plug-in extension points is specified by the internal attribute id of each extension point element. Generally speaking, a command extension point corresponds to a handler extension point while a menu extension point corresponds to a command extension point. It is worth noting that there is one-to-many relationships between the extension point and its corresponding extension point element. In other words, an extension point can contain multiple extension point elements, which means that there is no need to add extension points repeatedly to implement different plug-in functions.
Figure 3.

Figure 3.
The prototype of the plug-in for test case generation
In this work, the operating system for developing plug-in is Windows 7 while development environment is myeclipse / Eclipse that need the support of jdk. Therefore, jdk1.8 is selected, and we need to configure the environment variables JAVA_HOME, classpath and path. Finally, windowBuilder is used as a building tool of graphical interface. The developed test plug-in is shown in Figure 3. Therein, in the input string of destination path, one indicates that the node has been covered while zero denotes that the node is not covered. Moreover, the generated test case shown as a string is the value of three sides of the triangle separated by comma.
The plug-in, which achieves the function of obtaining the test case according to the specified path and population size, is developed using java. The user can input the target path in the input box and set the population size of GA in the population size input box, then click generate test case button to run the plug-in. The average time-consuming and the test case labels are used to display the results of generating the test case. After the plug-in completes, the test cases that cover the target path and the corresponding average run time are displayed in the corresponding tabs below.
6. Conclusions
A GA-based test case generation strategy is presented in this study, which is divided into two parts. The first part is the node probability coverage method, which is the detection basis for unreachable paths. In the second part, a path coverage method based on contact layer proximity, which introduces the contact vector as the difference representation of the nodes in the path, is proposed. Besides, the fitness function is designed by combining the two parts in order to quickly generate test cases. The experimental results show that the efficiency of test case generation is significantly improved. Finally, the test case generation algorithm is applied to the development of plug-in, and a plug-in prototype is developed. The user can directly complete the process of the test case generation through the plug-in interface. The primary contributions of this work include:
• A GA-based test case generation strategy is proposed. On the one hand, for the unreachable paths may affect the efficiency of the algorithm, it manages to detect the unreachable paths. On the other hand, the paths are covered by the traditional statement coverage. These two ways are combined to generate test cases quickly.
• A path coverage method based on contact layer proximity, which introduces contact vector to represent the execution difficulty of each node in the path, is proposed. Different from the traditional path coverage method based on layer proximity, the presented method deals with the problem of different execution difficulty caused by the existence of complex decisions and nested structures in the program.
• A plug-in based on the test case generation method is developed. In graphical interface of the developed plug-in, the user can click the generate test case button to run the plug-in after inputting population size and destination paths for GA. After execution, the average run time of the coverage target path and the corresponding test case will be displayed on the corresponding labels.
For single target path coverage, a test method based on contact layer proximity and node probability coverage is presented, and the results are shown by conducting experiments. However, there is no talk about multi-target path coverage. Therefore, the next step is to apply the proposed method to the test case generation with multi-target path coverage.
Acknowledgements
Thanks go first to the anonymous referees for their sound comments and suggestions. This work is partly supported by the National Natural Science Foundation of China under Grant Nos. 61762041 and 61462030, and the Science and Technology Project of Jiangxi Provincial Department of Education of China under Grant No. GJJ160427.
Reference
“Plugin-Based Systems with Self-Organized Hierarchical Presentation,” in
“An Eclipse Plug-in for Model Checking,” in
Chuan and D. W. Gong, “Evolutionary Generation of Test Data for Regression Testing Based on Path Correlation,”
Gong and L. N. Ren, “Evolutionary Generation of Regression Test Data,”
“What Your Plug-in Test Suites Really Test: an Integration Perspective on Test Suite Understanding,”
“Test confessions: A Study of Testing Practices for Plug-in Systems,” in
Van Deursen A, “Understanding Plug-in Test Suites From an Extensibility Perspective,” in
“Extending Web Applications with Client and Server Plug-ins,” in
“Test Case Generation Based on Combination of Schema Using Particle Swarm Optimization,”
“Exploring Variability-aware Execution for Testing Plugin-based Web Applications,” in ACM
“Selection of Paths for Regression Testing Based on Branch Coverage,”
“Evolutionary Generation of Test Data for Paths Coverage Based on Node Probability,”
“Evolutional Test Data Generation for Path Coverage by Integrating Neural Network,”
“Test Case Generation Based on Mutation Analysis and Set Evolution,”
