


© 2021 Totem Publisher, Inc. All rights reserved.
1. Introduction
Among traditional cardiovascular diseases, arrhythmias are extremely common and do great harm to human life. For example, they may exacerbate the state of other cardiovascular diseases and even induce sudden cardiac death in severe cases [1]. Effective monitoring of patients with arrhythmias is an advantage of disease detection. Nowadays, both diagnosis and detection of arrhythmias are primarily made by observing electrocardiogram (ECG) data of patients. However, it cannot avoid diagnosis errors caused by artificial readings of ECG data. For this reason, how to perform effective computer-assisted ECG data analysis has turned into a heatedly discussed problem in the field of arrhythmia diagnosis [2]. Currently, ECG data still feature with high dimensions, small sample size, strong feature correlations, etc. In this context, both domestic and overseas scholars attach great importance to classifying arrhythmias by efficiently and accurately using existing ECG data.
The UCI arrhythmia dataset is firstly used for classification in the Literature [3]. A back-propagation (BP) neural network-based arrhythmia classification algorithm is put forward by Raut et al. 4. It is utilized to investigate UCI arrhythmia data by virtue of statistical analysis software MLP and XLSTAT; and, the corresponding classification accuracy reaches 88.24%. As described in related work [5], an arrhythmia classification algorithm is also raised based on multiple features and support vector machine (SVM). To be specific, non-linear features of ECG signals are firstly extracted by kernel independent component analysis (KICA) and wavelet analysis and then fused with time-frequency features; subsequently, error-correcting output code-support vector machine (ECOC-SVM) is used as a classifier to conduct arrhythmia classification. Mitra et al. presented an algorithm [6] where linear forward selection and search were adopted to select relevant features, and this is an arrhythmia classification algorithm that selects a neural network as its classifier. Through 100 times of simulation, its accuracy turned out to be 87.71%. As far as Niazi et al. [7] are concerned, a modified F-Score is combined with forward sequence search for feature section. The selected optimal feature sub-set is incorporated in both SVM and KNN for classification. Under circumstances that 148 and 60 features are respectively utilized, accuracy of such a method reaches 68.8% and 73.8% respectively. A modified feature selection method is raised in Literature [8-9], classification is fulfilled by virtue of SVM, and its accuracy is up to 92.07%.
As for all the above approaches, both efficiency and accuracy of arrhythmia classification are improved to a certain extent by feature selection and machine learning. However, they fail to profoundly investigate and discuss defects inherited in arrhythmia data, such as class imbalance, excessively high dimensions and strong correlations of features 10. Moreover, these defects are not only particularly common in arrhythmia data, but also key factors that affect classification accuracy and unbiasedness [11]. Targeted at the existing problems associated with arrhythmia classification, an arrhythmia classification algorithm is proposed here based on SMOTE and feature selection. After data oversampling by SMOTE, redundant features are screened by K-part Lasso regression; finally, the above-mentioned feature selection method generated by an RF-RFE combination is adopted to select optimal features. In this way, the obtained feature sub-set is used for classification comparison among four classifiers. It has been proven by relevant experimental results that the proposed arrhythmia classification algorithm picks out 89 from 279 features; and, the accuracy of the RF based classification reaches 98.68%.
This paper is composed of the following sections. In Part 1, an introduction is made to not only various problems related to medical data and arrhythmic data, but also background knowledge of relevant algorithms. A SMOTE and feature selection-based arrhythmia classification algorithm is put forward in Part 2. In the Part 3, experiments are conducted on the basis of UCI arrhythmic data with the goal of evaluating the performance of the proposed algorithms from perspectives of accuracy, errors and Kappa coefficients. As for the final part, the whole paper is summarized and major research interests of the future are also presented.
2. Literature Review
2.1. Imbalanced Data and SMOTE Algorithm
Imbalanced data are targeted at the classification problem. It means that a sample size of a single class or multiple classes is far greater than that of other classes. Such a phenomenon may make a classifier skewed towards a class with a large sample size, which further leads to a drop in classification accuracy. Regarding actual data, the sample size of a positive class (manifested as normal heart rhythms in arrhythmia data) is significantly above that of a negative class (reflected as arrhythmias in arrhythmia data). Consequently, categorizing the negative class in the positive class by mistake can do much more severe harm than the opposite situation does; in addition, the former also costs a lot more than the latter 12. Below, the KNN algorithm that is based on the Euclidean distance is taken, as shown in Figure 1. In the event of k=10, samples, denoted by "+", to be classified are divided into Class A. Among 10 adjacent samples, 7 of them belong to Class A; and, according to the criteria of the KNN classifier, samples "+" should be categorized into Class A. Nevertheless, they actually fall into Class B. The reason for such incorrect classification is that there are only three samples in Class B. Clearly, this is a problem caused by data of class imbalance. In conformity with the present traditional classification algorithms, it is usually assumed that respective classes contain an identical number of samples. However, the actual data are featured with imbalance in most cases. In other words, the data contain one or more classes with a sample size greater than that of other classes 13. For the past few years, the problem of imbalanced data has attracted extensive attention from scholars at home and abroad. In terms of corresponding solutions, there exist three algorithms, mainly, of feature selection, data distribution adjustment and model training 14. Here, the oversampling method applicable to the distribution adjustment is utilized to solve the issue of imbalance of arrhythmia data, and through training and adjustment, imbalanced data can achieve a state of equilibrium.
SMOTE is an oversampling method in the area of resampling. Generally, samples that fall into a minority class are added into data to achieve data distribution balance, reduce the possibility of overfitting caused by a classification algorithm, and to improve the performance of the classifier applied in a test set 15. Different from random sampling where the samples are simply copied, the basic thoughts of SMOTE are to implement sample filling by means of linear interpolation. In this manner, overfitting incurred by sampling randomness can be effectively alleviated. As for the specific procedures of SMOTE, they are listed as follows:
1) A sample xi is randomly selected from samples in the minority class and K nearest neighbors are selected according to the Euclidean distance.
2) In line with a sampling rate n, another sample xj is randomly selected out from K neighbors of xi, which is repeated for n times based on Equation (1) to obtain a new sample xnew by means of synthesis:
Figure 1.
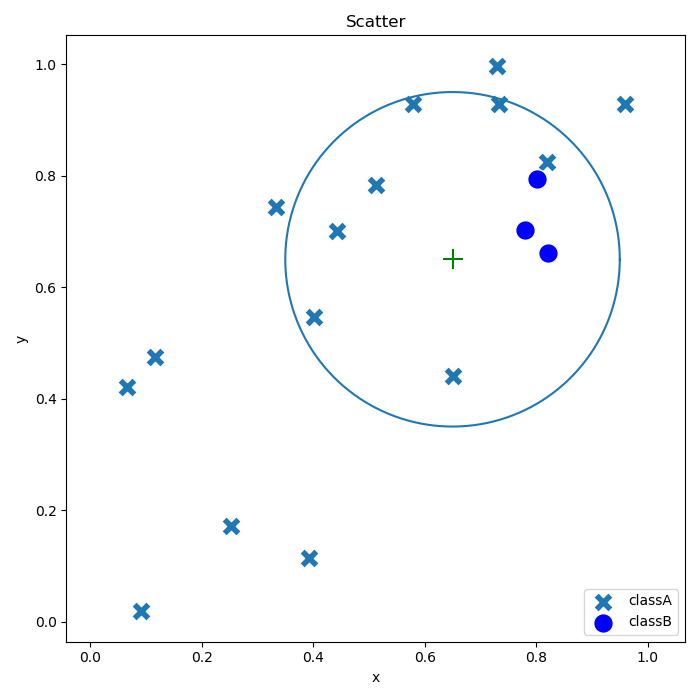
Figure 1.
Schematic diagram of class imbalance influence
2.2. Lasso Regression
Lasso regression was raised by Tibshirani 16 in 1996. As a compression estimate, it is commonly used to deal with problems of high-dimensional feature selection 17. Moreover, Lasso regression is also a modified model of ordinary linear regression. By virtue of a L1-norm penalty coefficient, a constraint condition is proposed for regression coefficients. The basic model can be expressed in Equation (2) below:
(2)
Where yirefers to a response variable xi = (xi1,xi2,…,xik) to a k-dimensional independent variable, and β j to a regression coefficient corresponds to the jth independent variable. In this equation, s is a constraint value for the sum of regression coefficients and s≥0. In this case, regression coefficients of some variables with a strong correlation and insignificant influence on response variables can be reduced to 0 by lowering the value of s. Once the regression coefficients that correspond to a variable drop to 0, such a variable should be deleted.
In terms of Lasso regression, there now exist three methods for determining values of s, including cross validation, extended cross validation and Mallows’s Cp 18. In this study, the value of s is confirmed by means of cross validation. Basic thoughts of cross validation are the same as those of extended cross validation. To be specific, a sufficiently high k value is firstly determined; then, values of 0, k/n, 2k/n and 3k/n, etc. are taken for s; afterwards, an expected error of s set at a certain value is determined by cross validation; finally, s with the minimum expected error can be found through comparison 19.
2.3. Random Forest
Random forest was put forward by Breiman 20 in 2001. As a classification algorithm of ensemble learning, its essence is to assemble multiple decision trees denoted by {h(X,θk),k=1,…}, where {θk} represents independent identically distributed random variables and k is the number of decision trees. Given that an independent variable X has been set, a voting algorithm is utilized to perform fusion of classification results generated by each decision tree; in this way, the optimal classification result can be achieved. Regarding specific implementation procedures of random forest, they are described below:
1) In a raw dataset, K sets of samples are taken with replacement by means of Bootstrap sampling; in this scenario, the sample capacity is identical to the raw data capacity. Samples that are not taken are written as out-of-bag data. Subsequently, K decision tree models are constructed based on such K sets of samples.
2) The raw data are assumed to contain N features. For each decision tree, m (m≤N) are extracted from such N features; then, optimal features are selected by means of information entropy to fulfill node splitting and classification.
3) Regarding new data classification results produced by all decision trees, fusion is carried out by a voting algorithm for the purpose of obtaining an optimal classification result.
Thanks to its capability of feature importance measurement, random forest turns into an important feature selection approach 21. Moreover, feature importance in classification is measured by three specific methods of random forest, including permutation importance, Gini importance and z-score. Among them, permutation importance is the most widely applied feature importance measurement method. Its basic principle can be detailed as follows. When a feature Xj is used to predict Y, the corresponding prediction error may increase after the value of Xj changes randomly. This signifies that Xj is a critical feature for Y prediction. It is assumed that Bootstrap sampling has been carried out. The samples are denoted as s=1, 2, 3…, ntree, and the corresponding out-of-bag data as
1) Value of s is set at 1, that is s=1, and a decision tree Ts is constructed by using samples.
2) The decision tree Ts is utilized to classify
3) Perturbation of feature Xj in the out-of-bag data is conducted, taking down the processed data
4) Steps (1)-(3) are implemented for s equal to 2, 3,..., ntree one by one.
5) Permutation importance metrics I(Xj) of the feature Xj can be expressed in Equation (3):
(3)
3. An Arrhythmia Classification Algorithm based on SMOTE and Feature Selection
Arrhythmia data usually have some defects of high dimensions, class imbalance and strong correlations of features. In terms of conventional arrhythmia classification algorithms, great improvements are made specifically to feature selection and classification ways; however, there have not been any investigations over problems associated with arrhythmia data. In this paper, an arrhythmia classification algorithm is raised based on SMOTE and feature selection with the goal of settling the above defects. Specifically, UCI arrhythmia datasets are selected as the research object; and, filling of data with missing values is implemented, which is followed by data oversampling by means of SMOTE. In this way, the problem of class imbalance in the dataset can be effectively improved. As far as feature selection is concerned, the selection effect of features affecting classification accuracy is not satisfied due to limitations of Lasso regression, although redundant features can be rapidly screened out. Considering this, K-part Lasso feature selection is combined with RF-RFE to select optimal features. Furthermore, efficiency of RF-RFE is also substantially bettered as massive redundant features have been removed during feature selection by means of Lasso regression. With the help of such two feature selection approaches, 89 of 279 features were applied in random forest; and, the obtained results were compared with those generated by three classifiers (logistic regression, KNN and SVM). As for procedures of data pre-processing and feature selection, they are presented in Figure 2 below.
Figure 2.
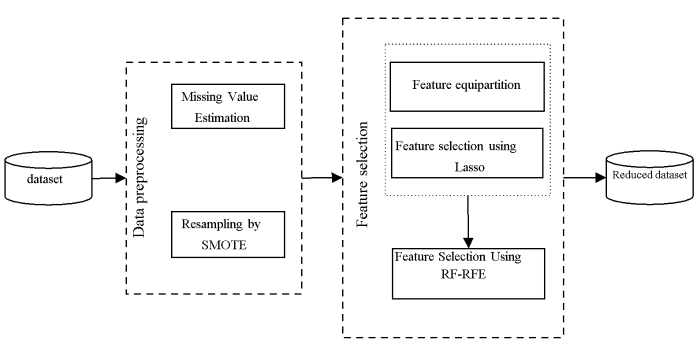
Figure 2.
Flow chart of data pre-processing and feature selection
3.1. Feature Selection based on K-part Lasso
As L1-norm penalty coefficients are used for Lasso regression, such a method is capable of making regression coefficients of correlated features and features with insignificant influence reduce to 0; then, features with such coefficients equal to 0 are deleted. In this way, feature selection is completed. However, high dimensionality of data may lead to high computation overhead during feature selection by means of Lasso regression, and a problem of overfitting may also occur due to a small sample size.
On the basis of the work [23], a feature selection method based on K-part Lasso is applied in arrhythmia classification. As for concrete a flow chart, it is given in Figure 3. Corresponding fundamental principles of the proposed approach can be described as follows. The feature set is uniformly and randomly divided into K sub-sets; after that, feature selection is conducted for each feature subset by virtue of Lasso and feature subsets selected from K subsets are combined together; then, the combined feature subset is subjected to Lasso feature selection again; finally, the optimal feature subset is acquired. Without a doubt, feature selection by K-part Lasso not only effectively lowers computation overhead incurred by arrhythmia data feature selection, but also reduces the risk of overfitting.
3.2 Feature Selection based on Recursive Feature Elimination and Random Forest
3.2.1 Recursive and Non-Recursive Feature Elimination
Presently, most feature selection approaches combined with random forest are based on non-recursion. In this aspect, representative methods include backward elimination based on importance measurement 24 and backward elimination based on both importance measurement and error rate 25. At the time of dealing with data with weakly correlated features, non-recursive feature selection based on random forest shows rather high efficiency and accuracy. However, a large error can be incurred if such a method is utilized to process data with strongly correlated features. In terms of arrhythmia datasets, their features are frequently of strong correlation. Here, correlations of features have been weakened by means of Lasso regression-based feature selection. Due to limitations of Lasso regression, it cannot be guaranteed that all correlations of features are entirely eliminated. For this reason, a big deviation may be caused by random forest based non-recursive feature selection once such a method is adopted to select features in arrhythmia data. For the purpose of comparing differences between recursive and non-recursive feature elimination, specific procedures of both algorithms are respectively presented below, as is their performance in a simple feature selection case.
Figure 3.
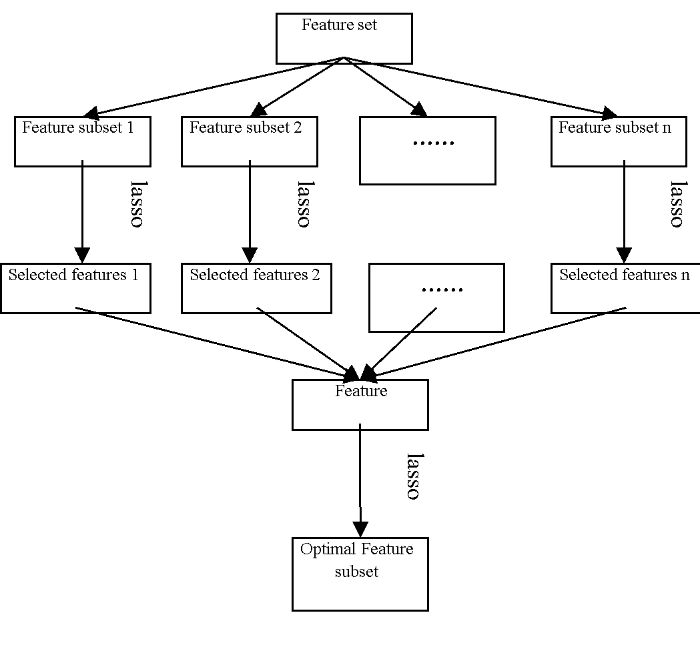
Figure 3.
Feature selection based on K-part Lasso
With regard to non-recursive feature elimination, it consists of four major steps:
1)Calculating importance of all features;
2)Training the classifier;
3)Eliminating features with the minimum importance;
4)Do not stop repeating steps 2 and 3 until the accuracy of the classifier reaches the required value.
In terms of recursive feature selection, its major difference from non-recursive feature selection lies in that: each time a classifier is trained, the former needs to measure the importance of features selected. The corresponding procedures are listed as follows.
1)Training the classifier;
2)Calculating importance of all features;
3)Eliminating features with the minimum importance;
4)Do not stop repeating steps 1-3 until all features are eliminated; after that, an optimal feature subset is selected to make sure that accuracy of the classifier can satisfy the requirement.
A simple case is given in the work of Gregorutti [21], proving advantages of recursive feature elimination under the circumstance that relevant features are correlated. Firstly, two correlated features (i.e., V1 & V2) with a category label correlation coefficient of 0.7 are presented; and, the correlation coefficient between such two features is equal to 0.9. Subsequently, four independent features (i.e., V3-V6) are defined and their category label correlation coefficient is 0.6. At last, three uncorrelated features (i.e., V7-V9) are incorporated to ensure experimental validity. When the algorithm starts to work, that is, before elimination of any feature, the importance of all features is shown in Figure 4(a). In this context, feature importance of V1 and V2, which are highly correlated to the category label, is below that of independent features V3-V6. In Figure 4(b), feature importance after two uncorrelated features are deleted is presented. After V2 is also eliminated in line with a principle of "with features of the least importance eliminated", feature importance of 5 remaining features is illustrated in Figure 4(c). As can be observed from this figure, such 5 features have no correlations; and, the importance of V1 is above that of the other four independent features. On this basis, V1 is defined as the most important feature by the recursive feature elimination algorithm. However, if non-recursive feature selection is performed, the most important feature V1 may be eliminated before the other four independent features V3-V6 are. This may place a great influence on feature selection effects.
(a) (b) (c)
Figure 4.
Figure 4.
Flow chart for selection of nine features based on recursive feature elimination
3.2.2. Recursive Feature Elimination and Random Forest
As a feature selection method, recursive feature elimination (RFE) is raised on the basis of support vector machine (SVM) 26. By virtue of SVM, weight at various dimensions of a corresponding hyperplane can be deemed as metrics of feature importance. According to values of these weights, relevant features can be ranked. Afterwards, classification accuracy is compared by means of repeatedly eliminating features of the minimum weight. In this way, feature selection is completed. This is a method named support vector machine-recursive feature elimination, that is SVM-RFE for short 27. In conformity with random forest, out-of-bag data of each decision tree are adopted to work out permutation importance of features corresponding to this decision tree 28. Subsequently, permutation importance of each feature can be obtained through calculations based on an integration method. By integrating massive results of a weak classifier (i.e., a decision tree), such a method is able to reduce deviations caused by a single classifier because of samples. Considering that random forest can also perform feature importance measurement with the help of permutation importance, recursive feature elimination is also applicable to it. The basic procedures are described as follows:
1)Training the random forest;
2)Calculating permutation importance of each feature;
3)Eliminating a feature with the least permutation importance;
4)Do not stop repeating steps (1)-(3) until all features are eliminated;
5)Selecting a feature that can produce the best random forest-based classification effects.
3.3. Classifier Selection
In order to make sure that feature subsets selected during feature selection is unbiased to classifiers, four classifiers (i.e., KNN, SVM, logistic regression and random forest) are adopted here to compare arrhythmia classification.
KNN is a common classification algorithm dependent on a thought of neighbors. Its fundamental principle is to classify samples according to features of several similar neighbors. In terms of SVM, one of the commonly used traditional classification algorithms, it fulfills sample segmentation on a hyperplane so as to classify the samples. Traditionally, logistic regression is specific to binary classification problems. In this consideration, it is inapplicable to arrhythmia classification. However, logistic regression can be optimized into multi-class classifier by softmax, enabling it to be also suitable for classification of arrhythmia data. As for random forest, it has been concretely introduced in Part 2.3. As far as processing of raw arrhythmia data is concerned, performance of such four classifiers is listed in Table 1. Clearly, the accuracy of random forest reaches 73.89% and its mean absolute error (MAE) turns out to be 1.8. Regarding the other three classifiers, their accuracy is 66.59%, 60.00% and 61.88% respectively. Without a doubt, random forest as a classifier based on the integration method outperforms the other three mainstream classifiers in arrhythmia classification. For this reason, random forest is selected as the principal classifier of arrhythmia classification in this research.
Table 1. Metrics comparison for classifiers
| Performance Metrics | Classification algorithm | |||
|---|---|---|---|---|
| SVM | KNN | Logistic | RF | |
| Accuracy(%) | 66.59 | 60.00 | 61.88 | 73.89 |
| MAE | 2.19 | 2.62 | 2.52 | 1.80 |
4. Experimental analysis
4.1. Datasets and Pre-Processing
4.1.1. Introduction to Datasets
An arrhythmia dataset in this paper is selected from the UCI database. Such a dataset contains 452 sample data that are divided into 16 classes. Among these classes, Class 01 is a normal class, while another 15 classes represent arrhythmia of diverse severity. Moreover, sample sizes of classes 11, 12 and 13 are all equal to 0, as given in Table 2. In addition, some classes stand for arrhythmias that are rarely seen, which further leads to a small sample size. This is a major reason why arrhythmia data becomes imbalanced. The arrhythmia dataset consists of 279 features. The first four features are standard attributes of age, sex, height and weight; and, the remaining attributes are extracted from data recorded in a standard 12-lead recorder, including QRS duration, P, Q and T waves. Additionally, not only do arrhythmia data show a severe defect of class imbalance and also contain lots of features, but features are strongly correlated due to the data themselves. Under such circumstances, data processing by virtue of a conventional feature selection approach and classification algorithms may lead to rather large errors.
Table 2. Arrhythmia datasets
| Class No. | Arrhythmia types | Sample size |
|---|---|---|
| 01 | Normal | 245 |
| 02 | Ischemic changes | 44 |
| 03 | Old Anterior Myocardial Infarction | 15 |
| 04 | Old Inferior Myocardial Infarction | 15 |
| 05 | Sinus tachycardy | 13 |
| 06 | Sinus bradycardy | 25 |
| 07 | Ventricular Premature Contraction | 3 |
| 08 | Supraventricular Premature Contraction | 2 |
| 09 | Left bundle branch block | 9 |
| 10 | Right bundle branch block | 50 |
| 11 | 1. degree AtrioVentricular block | 0 |
| 12 | 2. degree AV block | 0 |
| 13 | 3. degree AV block | 0 |
| 14 | Left ventricule hypertrophy | 4 |
| 15 | Atrial Fibrillation or Flutter | 5 |
| 16 | Others | 22 |
4.1.2. Data Pre-Processing
For missing values in the dataset, they are processed by combining linear regression prediction and mean value filling. Due to multiple features in the dataset, samples that are missed can be predicted by means of linear regression. Nevertheless, the actual value cannot be accurately predicted based on the corresponding predicted value because of a small training sample size. Therefore, the predicted value obtained by linear regression should be replaced with a mean value when such a predicted value goes beyond an interval formed by the minimum and the maximum values of the existing data in the sample.
Here, the SMOTE algorithm is utilized to carry out oversampling of the minority class. As can be observed from Table 2, the number of arrhythmia samples is extremely small in Classes 07, 08, 14 and 15. Due to limitations of such a small sample size, the number of neighbors can be only set at 1 in the event that oversampling of the entire sample dataset is directly completed by SMOTE. Apparently, such a method of configuring the neighbor count fails to be sound. It may place influence on minority classes with a large sample size. In this context, a segmentation based SMOTE method is adopted in this paper to take out data in Classes 07, 08, 14 and 15; then, oversampling is conducted for these four classes as well as the remaining classes. As a result, a SMOTE defect of data fitting inaccuracy caused by a comparatively small number of neighbors selected can be avoided.
As arrhythmia data contains massive dimensional data, the min-max normalization strategy is selected here to perform data pre-processing, as expressed in Equation (4). Hopefully, influence of dimensions on classification accuracy can be thus alleviated.
(4)
Where x* refers to the normalized data and x to raw data; in addition, min and max respectively represent the minimum and the maximum values of the raw data.
4.2. Experimental results
4.2.1. Experimental indexes
To verify the feasibility and effects of the proposed algorithm, it is evaluated according to three metrics: accuracy, Kappa coefficients and MAE. As for accuracy, it can be defined by the following Equation (5):
Where TP (i.e., true positive) refers to the number of patient samples correctly predicted, TN (i.e., true negative) to that of healthy population samples correctly predicted, FP (i.e., false positive) to that of healthy population samples that have been erroneously predicted as samples of patients, and FN (i.e., false negative) to that of patient samples erroneously predicted as samples of the healthy population. In terms of the Kappa coefficient, it can be used for both consistency and classification accuracy measurement. MAE, that is mean absolute error, is an expression of the mean value of absolute errors. It has the potential to preferably reflect an error between the predicted and the true values, as written in Equation (6) below:
(6)
Where m is the total sample size; zi and yi respectively stand for the predicted and the true classes of samples.
4.2.2. Algorithm Effects
Both Lasso and RF-RFE, as two feature selection approaches, are adopted here to select 89 from 279 features of the arrhythmia data. The selected 89 features can be utilized to achieve the highest classification accuracy. For the purpose of ensuring both validity and accuracy of the experiment, it is performed in strict accordance with 10-fold cross validation. As can be seen from Table 3, performance of four classification algorithms are all improved after feature selection and class imbalance elimination from the raw data. To be specific, accuracy and MAE of random forest are up to 98.68% and 0.078 respectively, superior to those of the other three algorithms. Through comparisons among data presented in Tables 1 and 3, it is clear that the accuracy of random forest is elevated by about 25%, rising from 73.89% to 98.68%, after SMOTE and feature selection algorithms are applied.
With the goal of determining parameters used in the experiment, the number of decision trees in the random forest is set by a method proposed by Liaw and Wiener, 2002. In detail, a default value mtree is selected first; then, classification effects generated by such a default value are compared with those produced based on values of mtree/2 and 2*mtree; finally, a value that can result in the optimal classification effect is adopted as a parameter setting of random forest in the experiment. In this paper, the default value denoted as mtree is defined to be 500, that is, mtree=500. In order to prevent the default value from being excessively large, control groups of mtree equal to 25, 50 and 100 are also established for comparison. Corresponding experimental results are given in Figure 5. Clearly, the maximum accuracy of random forest is achieved in a condition of mtree=500. For this reason, the number of decision trees, as an experiment parameter, is set at 500.
Table 3. Metrics comparison for the proposed algorithm
| SMOTE and Feature Selection | Performance Metrics | Classification algorithm | |||
|---|---|---|---|---|---|
| SVM | KNN | Logistic | RF | ||
| Yes | Accuracy (%) | 96.79 | 94.06 | 94.54 | 98.68 |
| Cohen’s kappa | 0.9653 | 0.9438 | 0.9408 | 0.9857 | |
| MAE | 0.22 | 0.31 | 0.44 | 0.078 | |
Figure 5.
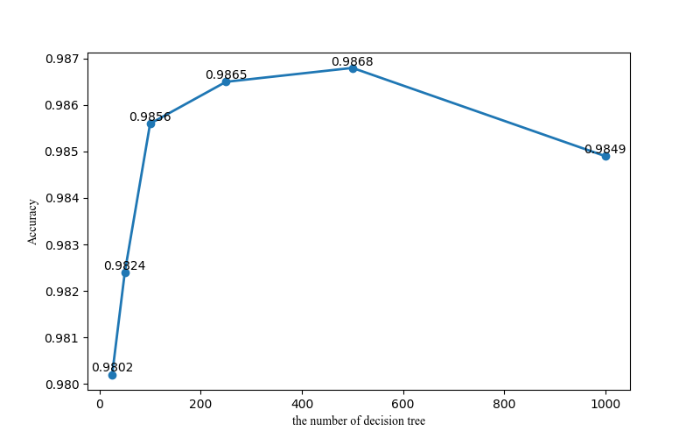
Figure 5.
Classification accuracy of random forest in a condition of various parameters
SVM is a machine learning method of binary classification and its performance is only second to random forest. In addition, a multi-classification method of SVM is now implemented via one-vs-one (OVO) 30 or one-vs-rest (OVR) 31 ways. In this study, SVM is applied in arrhythmia multi-classification by OVO. Currently, there are three widely applied kernels (i.e., Poly, RBF and Linear) in SVM. Here, classification effects of SVM with such three kernels are compared and the corresponding comparison results are listed in Table 4. As can be observed from this figure, the accuracy of linear SVM reaches a peak of 96.79%; by contrast, the accuracy of RBF and poly SVM turn out to be only 78.94% and 63%. If a proper kernel is selected, performance of SVM with this kernel may be substantially improved.
Table 4. Accuracy comparison for SVM with diverse kernels
| Kernel | Accuracy (%) |
|---|---|
| Poly | 63.44 |
| Linear | 96.79 |
| RBF | 78.94 |
Accuracy of logistic regression and KNN algorithms are 94.54% and 94.06% respectively. In addition, the number of neighbors in KNN also has a significant influence on classification performance of this algorithm. In this paper, classification accuracies of KNN are presented in the case of K=5, 10, 15, 20 or 25, as shown in Figure 6. Through comparison of these accuracies in a condition of different neighbor counts, k is designed to be 5 here.
Figure 6.
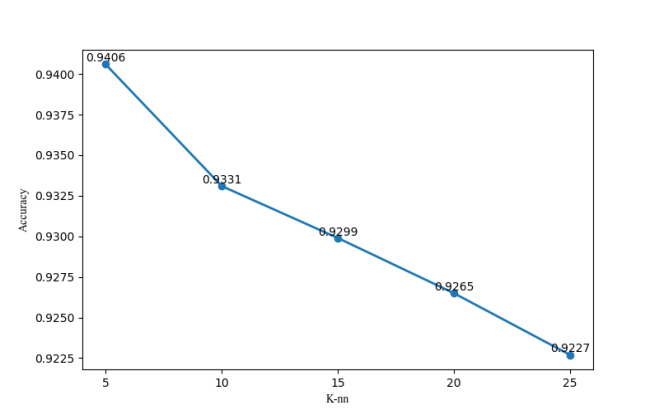
Figure 6.
Accuracy of KNN in a condition of different neighbor counts
In order to prove the influence of class imbalance on classification algorithms, confusion matrixes of random forest are compared before and after application of the proposed algorithm. According to Figure 7, where all data are normalized and ratios below 0.01 are not displayed, horizontal and vertical axes represent 13 classes of the arrhythmia data. It can be clearly observed from Figure 7(a) that most samples are categorized into Class 01 (the normal class) when the problem of class imbalance is not processed. This means that abnormal samples are erroneously classified into normal samples. As proven in Literature [12], the cost of such incorrect classification is huge. In Figure 7(b), class imbalance adjustment and feature selection result in both a great accuracy increase on the whole and on the classification improvement of each class.
(a) (b)
Figure 7.
Figure 7.
Confusion matrix comparison of random forest before and after adoption of SMOTE/feature selection
4.2.3. Effect Comparison
According to two traditional feature selection algorithms, features are selected by principal component analysis (PCA) and mutual information (MI) 29. The number of these features as well as their classification accuracy in SVM and random forest are all listed in Table 5 below. In terms of PCA, 80 are selected from 279 features and are used for classification, generating an accuracy of 70.89% in SVM. Once mutual information is combined with random forest, 65 features are selected from them and the corresponding accuracy obtained reaches 77.02%. By contrast to the above two traditional feature selection methods, accuracy of the proposed algorithm proposed respectively increases by 27.79% and 21.66%.
Table 5. Comparison of the proposed algorithm and traditional feature selection approaches in accuracy and number of features
| Algorithm | Features | Accuracy (%) |
|---|---|---|
| PCA+SVM | 80 | 70.89 |
| MI+RF | 65 | 77.02 |
| Proposed | 89 | 98.68 |
Table 6. Accuracy comparison between the proposed algorithm and other algorithms under study
| Algorithm | Train-test split | Number of selected Features | Accuracy (%) |
|---|---|---|---|
| Proposed | 10-fold CV | 89 | 98.68 |
| MLP NN | 3-fold CV | 88.24 | |
| Filter+Wrapper+Knn | 20-fold CV | 60 | 73.80 |
| Filter+Wrapper+SVM | 20-fold CV | 148 | 68.80 |
| RF+SVM | 90-10 | 94 | 92.07 |
| GA+C4.5 | 75-25 | — | 78.76 |
With the goal of verifying classification effects of the proposed algorithm, its results are compared with those obtained by arrhythmia classification algorithms that select the UCI dataset. As revealed in Table 6, the arrhythmia classification algorithm combined with MLPNN achieves an accuracy of 88.24% in Literature [4]. In Literature [7], an arrhythmia classification algorithm is put forward in conjunction with filter and wrapper methods of feature selection. Firstly, the modified F-score method is used to filter out useless features; then, forward sequence search is conducted to find out an optimal feature sub-set for KNN (accuracy: 73.80%) and SVM (accuracy: 68.80%) based classification. An arrhythmia classification algorithm combined with the wrapper method and SVM is raised by Mustaqeem et al. [9]. To be specific, features are firstly selected by random forest and z-score, which is followed by SVM based classification. In this way, its accuracy reaches 92.07%. In opinions of Ayar, arrhythmia feature selection and classification can be fulfilled by combining GA and C4.5 together 32. Although arrhythmias are a multi-class problem, it only attaches great importance to two indexes. One is being attacked by a disease and the other is being healthy. Therefore, two models are established in this paper, that is, a binary classification model and a multi-class model. While the former involves all cases of being attacked by a disease and being healthy, generating an accuracy of 86.96%, the latter covers all arrhythmia cases and has an accuracy of 78.76%. Compared with the method proposed in Literature [9] (accuracy: 92.07%) and other SVM-based methods put forward in Literature [7], accuracy of the proposed algorithm here is respectively elevated by 6.61% and 29.88%.
4.2.4. Ablation Experiments
We performed ablation experiments on the algorithm to further check the efficacy of our proposed algorithm and divided the experiments into four groups: ( 1) the original data group (data has not been processed), (2) SMOTE+Lasso, (3) SMOTE+RF-RFE, and (4) our proposed algorithm. To ensure the experiment's fairness, both experiments use RF as the classification algorithm while the experiments use 10-fold cross validation. As revealed in Table 7, compared with the other three methods, our proposed algorithm uses the least number of features (83), obtains the highest classification accuracy (98.68%) and specificity (99.48%), and also retains a high degree of sensitivity.
Table 7. Accuracy comparison between the proposed algorithm
| Algorithm | Features | Accuracy (%) | Sensitivity (%) | Specificity (%) |
|---|---|---|---|---|
| Origin | 279 | 72.52 | 36.52 | 89.64 |
| smote+RF-RFE | 122 | 98.59 | 98.46 | 99.48 |
| smote+Lasso | 102 | 98.53 | 98.68 | 99.23 |
| Proposed | 89 | 98.68 | 98.61 | 99.48 |
As shown in Table 8, the time spent between our proposed algorithm and traditional RF-RFE in the selection stage of the function is given. The amount of time spent on our proposed algorithm is around 1/5 of the conventional methods. This also shows that the approach of using the combination of the two feature selection methods will significantly reduce the time for conventional wrapper RF-RFE to pick the best combination of features under the assumption of maintaining the accuracy of the classification. To summarize, our proposed approach not only guarantees classification accuracy, but also selects the best features.
Table 8. Time spent in feature selection phase
| Algorithm | Time (s) |
|---|---|
| smote+RF-RFE | 123 |
| Proposed | 24.19 |
5. Conclusion
In order to settle problems of class imbalance and excessively high dimensions that exist in arrhythmia classification, an arrhythmia classification algorithm based on SMOTE and feature selection is raised in this paper. Influence of class imbalance on classification is clearly manifested in Figure 7. In a context of class imbalance, a large number of abnormal samples are erroneously classified into the normal class. Subsequent to SMOTE-based oversampling and feature selection, classification accuracy of each class improves wholly. Additionally, due to strong correlations of features in arrhythmia data, it is less likely for a conventional feature selection approach to accurately and rapidly select an optimal feature. For this consideration, two feature selection methods Lasso and RF-RFE are adopted for this research because they can be preferably adaptable to features with strong correlations. In the end, classification is carried out by random forest. 89 of the 279 features in the arrhythmia data are selected and used for classification by the proposed algorithm. The classification accuracy of random forest is up to 98.68%.
In the future, research will still focus on resolving problems of class imbalance associated with arrhythmia data. For this purpose, cost-sensitive learning and the modified SMOTE methods may be adopted. If conditions are proper, more real data and life-related features (e.g., living areas and dietary habits) will be incorporated and used for empirical research. Hopefully, both efficiency and accuracy of classification can be further improved.
Reference
Advances in the study of arrhythmogenic mechanisms
Heartbeat-based end-to-end classification of arrhythmias
Cardiac arrhythmia classification based on multi-features and support vector machines
Cardiac arrhythmia classification using neural networks with selected features
Wrapper method for feature selection to classify cardiac arrhythmia
Multiclass classification of cardiac arrhythmia using improved feature selection and SVM invariants
Overview of imbalanced data classification
SMOTE: synthetic minority over-sampling technique
Review of imbalanced data classification methods
Special issue on learning from imbalanced data sets
Summary of research on SMOTE oversampling and its improved algorithms
Regression shrinkage and selection via the lasso
Summary of feature selection methods
Some comments on Cp.
Study on wine evaluation based on LASSO regression
Random forests
Correlation and variable importance in random forests
Feature selection algorithm based on random forest
K-part Lasso based on feature selection algorithm for high-dimensional data
VSURF: an R package for variable selection using random forests
Gene selection for cancer classification using support vector machines
Overview on feature selection in high-dimensional and small-sample-size classification
Classification and regression by randomForest
Estimating mutual information
A novel hybrid intelligent method based on C4. 5 decision tree classifier and one-against-all approach for multi-class classification problems
An ECG-based feature selection and heartbeat classification model using a hybrid heuristic algorithm
