


1. Introduction
There is a noticeable trend of LCD technology being applied to automotive driving dashboards. The biggest difference between this new type of digital intelligence dashboard and traditional mechanical dashboards is that the display contents can change at any time, which brings a new problem: how can we accurately analyse the needs of drivers with various proficiency for different information?Instrument interfaces cannot intelligently adapt to all kinds of drivers. In order to solve this problem, a fuzzy analytic hierarchy process (FAHP) based on accelerated genetic algorithm has been proposed in previous research. With the application of this process in design practice, the results show that it is inconvenient for designers to calculate. Therefore, the proposed research put forward a more simple and effective index weight analysis method in the following study.
This research first studied the application and the current research status of the new full LCD technology in the intelligent development process of automobiles. Then, the researchanalysed the possibility and design direction of intelligent dashboard interaction interfaces that could satisfy the individual demands of drivers relying on the foregoing technology. Afterwards, a method for evaluating the demand level of various drivers for various types of information during driving is produced. As a result, a case combines automobile dashboard interface improvement and optimisation design practice and shows improvementfrom what was given in previous studies [1]. The design proposal is offered on the basis of the result obtained through this analysis method.
2. The Automobile Full LCD Dashboard Interface
2.1. Application of the Full LCD Technology to Automobiles
With the rapid development of science and technology in the information era, tremendous changes occur in traditional automobile products, and an obvious development direction is intelligentization of human computer interaction (HCI). The foundation of these changes lies in the rapid development and application of corresponding technologies, especially in automobile electronics. The application level of automobile electronics around the world continuously increases; the average value of automobile electronics for every new automobile was increased to USD 2,123 in 2004 from USD 672 in 1990. In 2001, the cost of electronic parts inside an automobile accounted for 23% of its total cost on average, while this proportion was increased to 40% in 2015[2]. By 2017, the proportion kept rising, which means this proportion will further increase in the future.
Regarding these electronic components, technologies and materials used for driving information display are also undergoing rapid development and the full LCD dashboard interface has been applied to several new models of automobiles, such as the newly modified BMW 7 Series, Cadillac XTS, new Jaguar XJ, Volvo V40 as shown in Figure 1, new generation of Land Rover Range Rover, and BYD Sirui. The application of the full LCD finds space for new HCI modes and functions. It can be expected that more and more vehicle models will adopt full LCD dashboards in the future, which is expected to be accompanied by the emergence of varying new dashboard interfaces. In addition, the design of these new interfaces has many new features compared with traditional dashboards, proposing new requirements for the design contents and methods.
Figure 1.
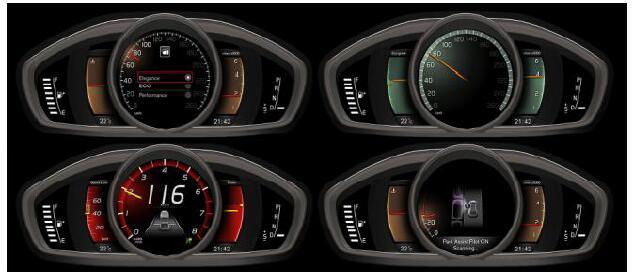
Figure 1.
Volvo V40 dashboard interface design
Sources: https://www.ubergizmo.com/2012/11/volvo-v40-adaptive-digital-display/
2.2. Full LCD Automobile Dashboard Interface and Intellectualization
2.2.1. Features of the Automobile’s Full LCD Dashboard Interface
The automobile dashboard interface applying the full LCD technology has several new features, as follows:
1) Contents displayed are variable and diversified: unlike the traditional mechanical or semi-mechanical dashboard, on which the pointers and scales are physical hardware whose styles and colors cannot be changed at will, the full LCD dashboard is a whole screen. This means that all kinds of pointers, scales, numbers, and texts are images displayed, and pictures and colors in these images can be changed freely. Therefore, if an automobile has been equipped with a full LCD dashboard as shown in Figure 2, it is possible to design a variety of matching display schemes to meet the demands of different types of users under different scenarios.
Figure 2.
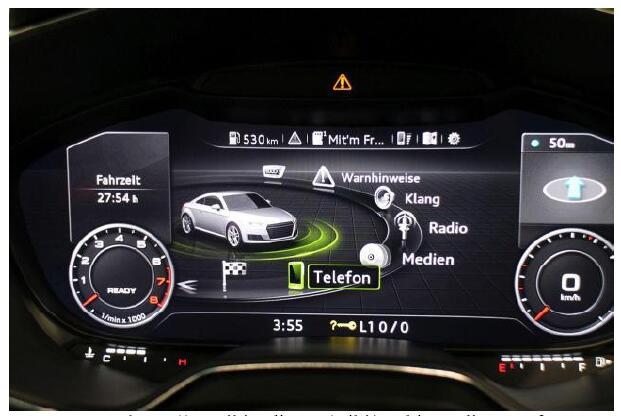
Figure 2.
MMI-Menu onAudi virtual cockpit,Audi TT8S
Sources: https://en.wikipedia.org/wiki/Multi_Media_Interface
2) Additional function and extension: because of the display variability, the dashboard is able to achieve more functions. For example, it is able to display targeted prompts in a timely manneraccording to different driving processes and environmental conditions, in order to remind the driver of the information in need of attention.
3)The driver is flexible to make choices: in a traditional automobile model, drivers must face a constant dashboard with a fixed style and contents. However, the new full LCD dashboard interface allows the driver to choose from a variety of styles and contents according to their preferences, driving habits, and different information requirements.
4)The information process of human computer interaction (HCI) is more complicated: the HCI between the driver and the automobile is a complex process during driving. Variable and diversified contents displayed by the full LCD dashboard interface make this process complicated, which also makes it necessary to consider more issues in design.
2.2.2. Intelligent Development Trends of the Automobile Dashboard Interface
Based on the above analysis of features of the new automobile dashboard interface, the intelligent display interface is bounded to be one of the leading development trends of future automobile HCI. The intelligent automobile dashboard interface presents an interface that can actively display the most suitable information in due time based on requirements of different drivers under different driving scenarios, rather than the mechanically fixed contents displayed by the traditional interface.
In order to implement this intelligent function in an automobile, the first thing is to collect information on the driver and the driving conditions, which can be achieved by identifying the driver’s identity [3-6], analysing the driver’s behavior [7-8], and installing all kinds of driving sensors. The next stage will be analysing and making decisions for this information, which will be realised by implementing on-board computers based on the designed decision-making rules and standards. Finally, information content displayed on the dashboard interface is controlled based on the analysis and decision-making results.
2.2.3. Related Current Research Status and Research Emphasis of this Paper
By reviewing existing relevant research, the first type of research focuses on the application of hardware and software in relation to the full LCD technology. For example, Sun et al. studied the software and hardware design of the dashboard based on QNX, embOS operating system, emWin graphics library, and serial bus [9-11]. Another type of research focuses on the influence of certain conditions or display information for drivers. For example, Cui et al. studied factors such as pointer color and hazard prompts in the dashboard interface [12-14]. There is also a type of dashboard design research combining ergonomics and Kansei engineering, such as the application of the human-orientated design method studied by Wang in the design of the automobile dashboard [15]. These studies are indispensable since they play a crucial role in achieving the intelligent HCI interface. However, for the specific design work of the automobile dashboard interface, it is also critical to provide the foundational rules and basis for the judgment logic in order to realise the intelligent content display. In other words, determine the types of drivers and driving scenarios and study the requirement levels of different drivers for various information displays in each scenario. In this way, the corresponding display content will be designed according to different levels of requirement. However, the research in this aspect is still scarce at present.
Therefore, this paper regards this aspect as the core approach, the design contents and working focus of the new automobile intelligent dashboard interface are analysed, and methods for confirming the requirement level of a driver for displayed contents under various driving conditions are determined through study in order to provide basis for the specific interface design. Finally, a further description aiming at highway traffic safetyis provided for dashboard interface design cases.
3. Design Contents and Focus of the Intelligent Interface
3.1. Changes in the Contents Displayed by the New Automobile Dashboard Interface
Unlike the previous mechanical dashboard interface, which only has a fixed style, the design of the new intelligent automobile dashboard interface based on the full LCD is required to create variable styles according to features of different drivers and to adjust the displayed contents under different driving scenariosin a timely manner. In the design work, the first thing to be considered is the requirements for different types of information for drivers. For example, for new drivers or those who are not familiar with the operation of a new automobile, instant obvious prompts for acceleration, braking, and shifting could help drivers become familiar with operations in a shorter period, reducing incorrect operations and strengthening safety. Secondly, it is necessary to consider different contents displayed in different scenarios. For example, if the road conditions need the driver to frequently accelerate, brake, steer, and shift, the speed per hour, rotating speed, and gear displayed in the interface are very important. Information such as water temperature and oil quantity shall be weakened and only strengthened when necessary; the date and the time displayed shall be regarded as the interference information.
If the traditional monotonal dashboard interface design style is expressed as D00,A represents the set of different types of users in the new design, a represents a user type, the new design includes i(a∈N and 1≤a≤i) types,B represents the set of different display contents under various scenarios in the new design, and b represents a scenario. The new design scheme includes j (b∈N and 1≤b≤j) scenarios. The overall design scheme of a new intelligent automobile dashboard interface refers to the change from the original monotonous D00 to the new design combination matrix DAB:
$D_{00}D_{AB}=\begin{bmatrix} D_{11} &D_{12} &\cdots &D_{1b} &D_{1j} \\ D_{21} &D_{22} &\cdots &D_{2b} &D_{2j} \\ \cdots &\cdots &\cdots &\cdots &\cdots \\ D_{a1} &D_{a2} &\cdots &D_{ab} &D_{aj} \\ \cdots &\cdots &\cdots &\cdots &\cdots \\ D_{i1} &D_{i2} &\cdots &D_{ib} &D_{ij} \\ \end{bmatrix}$
3.2. Work Focus in the Design of the New Automobile Dashboard Interface
Based on the changes in the contents of the new automobile dashboard interface, the work focus in its design is mainly reflected through the accurate analysis of the human computer information interaction relationship of the automobile dashboard interface.
This process requires grouping different types of drivers first, which means determining each type of users ai in the set of user types A, and the specific division method shall be varied depending on the different design goals. For example, drivers are classified according to their gender, occupation, or personality. Sporty, classical, science fiction, simple, elegant, and fashionable interface styles are designed to meet the requirements of users with different aesthetic preferences. However, if users are classified from the physiological perspective, it is possible to design an interface with different patterns and font sizes in order to adapt to the visual requirements of some types of drivers.
Also, it is also important to divide different driving scenarios, which means determining each scenario bj in the set of driving scenarios B, and the division method shall also be different based on the specific design goals. For example, according to the external natural environment, the dashboard interface with different brightness can be adjusted for sufficient light at daytime and low light level at night, a cozy warm-color interface for cold or snowfield scenarios, a more vivid interface for vast environments such as tundra, and a fresher and calmer interface for busy and noisy urban environments.
In order to present multiple styles by the intelligent automobile dashboard interface, the human computer interface information is conveyed and changed in a timely mannerbased on the demand of the driver. For this purpose, after the design work has determined the set of user types A and the set of driving scenarios B, it is also required to further analyse for different requirement levels of each type of driver in driving scenarios and different information contents displayed. Then, take the analysis result as the basis to design the specific contents of the display interface in each case and present as Dab, and then combine all the Dab into a complete dynamically changeable entirety with multiple styles as DAB. Based on the display interface solution matrix combination designed, in combination with the identification of various drivers, detection, driving status sensors, and the on-board computer mentioned above, the result will be analysed and then independently judged as Dab, and then the intelligent automobile dashboard interface will be adapted to the driver’s demand.
4. Interface Display Information Demand Level Analysis
4.1. Analysis Method
The focus of the design of the new intelligent automobile dashboard interface is to accurately analyse the requirement level of different types of users for various display information under different scenarios. The analysis method in this paper includes three steps: first, determine the evaluation indexes and the statistical weight of the information requirement level. Because this involves the experience and skills of the dashboard interface design profession, the expert method will be applied to determine it. Second is the actual design work; according to the different user groups that the design goal faces, the corresponding sampling research is carried out, and the evaluation value of the user's information requirement level index is obtained through the psychological measurement method. The third step is to generate a specific requirement level score that is determined by calculating the weighted average. The proposed specific display interface scheme will be designedon the basis of the above score. The information demand of driver can be promptly shown on dashboard such as Figure 3.
Figure 3.
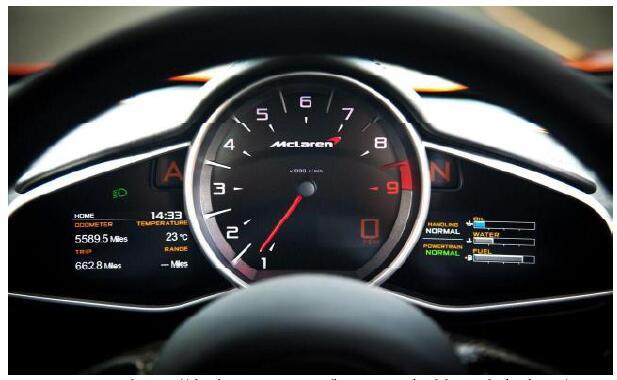
Figure 3.
The interface display information
Sources: https://designsmaz.com/best-car-dashboard-designs/
4.2. Determining the Evaluation Indexes and the Respective Weight of Information Demand Level
For this research, seven experts were engaged in the design of dashboard interfaces for many years in automobile companies. Because the dashboard display and the driver’s information reception during the driving process are their primary considerations in design, three factors are selected to indicate information: intensity, timeliness, and sustainability, as is shown in Table 1.
Table 1. Evaluation indexes of display information demand level
| Index | Symbol | Instructions |
|---|---|---|
| Information intensity | R1 | It refers to the prominence degree of color, size, font, line, and other features of the information display that can cause the degree of driver’s attention. The higher the intensity demand, the higher the requirement level for information. |
| Information timeliness | R2 | It refers to the requirement level for timely information display, including display in advance. The failure to timely display information may cause the driver to make incorrect judgments. The higher the demand for timeliness, the higher the requirement level for information. |
| Information sustainability | R3 | It refers to the length of time that information is continuously displayed. The longer the information needs to be displayed, the higher the demand level for information. |
Seven experts evaluated the importance of the three indexes. The weight is calculated according to the assignments given by experts. The total scores of assignments are also calculated respectively corresponding to R1, R2, and R3, where the sum of the assignment of R1 is ZR1=50
$Z{{R}_{2}}=\sum\limits_{n=1}^{7}{{{R}_{2n}}}$,$Z{{R}_{3}}=\sum\limits_{n=1}^{7}{{{R}_{3n}}}$
Then, calculate the weight of each index, which is set to be w1, w2,and w3, among which wi=ZRi/(ZR1+ZR2+ZR3)
Table 2. Evaluation index weight of display information demand level
| Weight | w1 | w2 | w3 |
|---|---|---|---|
| Value | 0.586 | 0.280 | 0.134 |
4.3. Measure the Demand Level for Display Information and Guide the Design
The evaluation value of the demand level for each type of display information is measured by questionnaire. The statistical average of all the answer results for this question is recorded as qni-ab, which means the single evaluation value of the ith index for the nth type of display information under a style and b scenario. Then, conduct the additive weighted comprehensive evaluation to obtain the requirement level Qn-ab of the driver for the nth display information under a style and b scenario, calculating
${{Q}_{n-ab}}=\sum\limits_{i=1}^{3}{{{w}_{i}}{{q}_{ni-ab}}}$
Then, take it as the basis to design the interface display contents. At first, rank the requirement level for each type of display information under a style and b scenario from high to low, and demands could be classified into high demand, low demand, and no demand. Then, in the corresponding interface design, high demand and low demand information will be displayed. The display style varies according to different combinations of ab. If some information is high demand in some cases, the corresponding display area will be increased. The higher the demand level, the more conspicuous the display color, brightness, font, line, and size. The display area corresponding to information of low demand is reduced. The lower the demand level, the less conspicuous the display information. The information will be hidden when it is not required in some cases.
In addition, the interface design can also appropriately add the intelligent sensing information display contents as needed. For example, in the following case, acceleration and braking information is added at the upper edge of the interface for the novice driver. The driver's pedaling force can be sensed by sensors mounted on the acceleration and the brake pedal and then displayed on the dashboard interface, which can help the green hands avoid incorrect operations and improve active driving safety. Similarly, if a sensor is installed on the shifting handrail, in the case where the gear position is not displayed on the interface or the gear position information is dim, manually touching the shift lever will control the dashboard interface to display the current gear for the purpose of reminding conspicuously.
5. Case Study
In this research case, the market survey of vehicles for consumers shows that the improvement direction is carried out in combination with FAW-VOLKSWAGEN. It applies the dashboard style for the existing vehicle models as the foundation and then follows the new full LCD dashboard interface design direction in the future. It also employs the foregoing method to measure and study the HCI relationship. Driver types and scenarios are diverse. As an example, this study selects two types of drivers, namely, skilled and unskilled drivers, and selects three scenarios, including parking, frequent variable speed and gear shifting and turning, and long-distance driving at a constant speed, which constitutes six combinations. The display information is divided into 15 types, and some information is classified into one type because it always appears at the same time, such as total mileage and short mileage. The last misoperation prompt refers to information to be displayed after the corresponding situation appears. For example, the door is not closed, the tire pressure is abnormal, and the seat belt is not tied. The tested objects are selected from the Volkswagen consumer survey project. According to the results of driving years and self-judgment in the questionnaire, 50 typical skilled drivers and 50 novice drivers are selected. They are scored according to their requirement level for each type of information in each case, and then the comprehensive evaluation value is calculated, including the first digit behind the decimal. The results are shown in Table 3.
Table 3. Information demand level in each case
| Demand level conditions information | Skilled driver | Unskilled driver | ||||
|---|---|---|---|---|---|---|
| Parking | Variable speed | Constant speed | Stop | Variable speed | Constant speed | |
| Current vehicle speed | 0 | 88.9 | 62.3 | 0 | 100 | 93.7 |
| Current rotating speed | 0 | 92.8 | 75.9 | 0 | 78.6 | 76.5 |
| Current gear | 24.2 | 65.2 | 44.5 | 43.9 | 95.7 | 87.8 |
| Instantaneous/average fuel consumption | 0 | 73.7 | 96.8 | 0 | 47.0 | 86.4 |
| Turn signal on | 35.1 | 75.6 | 79.6 | 67.8 | 89.9 | 98.0 |
| Accelerator pedaling force | 0 | 24.6 | 8.2 | 34.3 | 88.6 | 85.3 |
| Braking force | 0 | 10.2 | 8.0 | 21.0 | 79.8 | 62.1 |
| Current water temperature | 32.2 | 62,5 | 77.8 | 34.1 | 63.2 | 88.9 |
| Current fuel quantity | 89.9 | 69.3 | 82.9 | 93.1 | 65.1 | 90.6 |
| Total and short mileage | 76.8 | 35.0 | 76.5 | 79.5 | 22.2 | 73.0 |
| External temperature | 78.5 | 12.3 | 54.4 | 87.7 | 9.2 | 67.9 |
| Internal temperature | 89.3 | 24.5 | 78.8 | 88.3 | 24.1 | 91.0 |
| Current time | 79.3 | 34.2 | 75.9 | 67.9 | 32.3 | 76.4 |
| Current date | 65.4 | 6.5 | 56.5 | 53.2 | 6.7 | 40.2 |
| Misoperation prompt | 87.8 | 70.8 | 79.3 | 78.6 | 95.8 | 97.7 |
The design of the dashboard interface based on the evaluation value of the demand level for information in each caseis shown in the table. Information with more than 50 scores belongs to high demand, which shall always be displayed. The higher the demand, the more conspicuous the information is displayed: larger area, brighter and more conspicuous color, and closer to the center. Information with 15~50 scores belongs to low demand, which will be divided into displayed information and hidden information. Information with less than 15 scores will not be displayed actively in this case unless the driver operates manually. Then, the typical display scheme in each case is designed on this basis, as shown in Figure 4.
Figure 4.
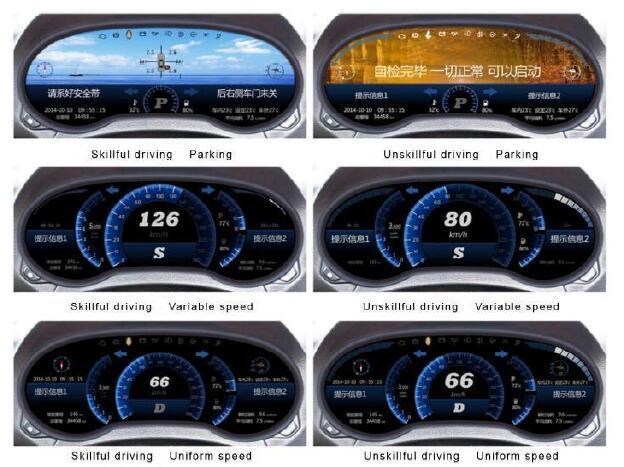
Figure 4.
Display interface design figures in six typical cases
The above are display interfaces in six typical cases, and the entire display scheme also has transitional changes between various typical interfaces. For example, as the speed of the vehicle increases, the driver must pay more attention to the status of the vehicle. Therefore, the area corresponding to information such as the speed of the vehicle and rotating speed will constantly increase, and the color also gradually becomes more conspicuous, while the other secondary interference information becomes dimmer and dimmer. According to this way of thinking, as long as designers fully understand the different types of drivers’ undefined requirements for information in different situations, they can design the instrument interface that can best meet the needs of the driver at every moment. The following showcases other scenarios for intelligent automobile instrument interfaces under the design ideas and methods presented in the text are shown in Figure 5.
Figure 5.
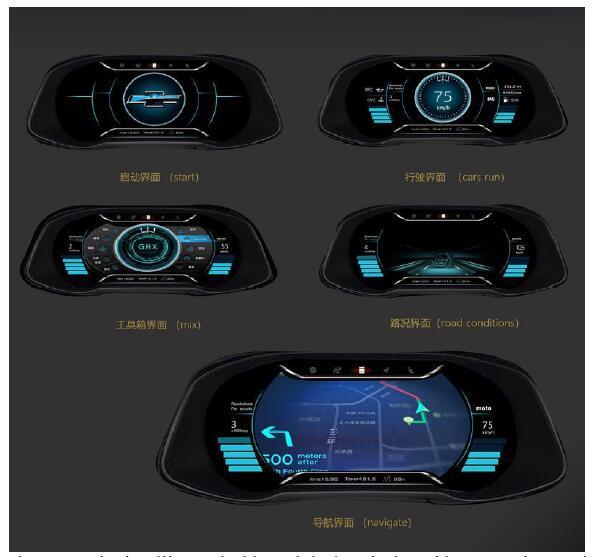
Figure 5.
The intelligent dashboard design designed by Pan Xiangwei
Of course, the intelligent automobile instrument interface adapts to different scenarios and drivers’ changing functions, and it needs to rely on artificial intelligence technology to sense and analyse the scenario and driver information [16]. Therefore, this paper studies the design part of the intelligent instrument interface information content, which needs to cooperate with the intelligent hardware and software development part in order to realise the complete vehicle instrument design.
6. Conclusions
In this paper, in order to solve problems such as unskilled drivers causing potential traffic dangers due to misjudgment, the approach of designing an intelligent dashboard interface capable of satisfying the demands of drivers with different levels of proficiency is proposed. It tries to develop an intelligent automobile dashboard interface under the full LCD trend.
The main innovative viewpoints of this paper are as follows: firstly, aiming to design the vehicle liquid crystal dashboard (which is gradually becoming the mainstream at present), this paper proposes that the display should not only take into account different driving scenarios but also consider the different characteristics of the driver. A new reference dimension is introduced for the related design work. Secondly, the current multi-interface style of the vehicle LCD dashboard in the current market is mainly concerned with the driver’s undefined subjective preferences. Meanwhile, this paper proposes that safety in the driving process is closely related to the demand for display information. The change of LCD panel display content should mainly consider the individual objective characteristics of different drivers, because the reaction and judging speed of drivers with different proficiency to information are different. The designed dashboard is helpful for improving driving safety. Finally, this paper proposes a set of scientific and novel methods to judge the degree of information requirements for various drivers in different scenarios. Therefore, it can improve the current situation that designers mainly rely on personal experience and subjective judgment in the design of automobile instrument interface and lack scientific and objective judgment basis. Based on the ideas and methods proposed in this paper, the display content of the intelligent automobile instrument interface designed has the advantages of the new display technology and will help improve the convenience, comfort, and driving safety of the driver.
Acknowledgments
The corresponding author of this article is Haiyang Yu. This article is supported by the University Philosophy and Social Science Research Fund Project of Jiangsu Province (No. 2017SJB1810).
Reference
“The Automobile Intelligent Dashboard Design to Enhance Driving Safety,”
DOI:10.4028/www.scientific.net/AMR.1079-1080.1010
URL
[Cited within: 1]

The paper studied on hidden dangers in traffic safety caused by misjudgment of driving operation information, along with the development of the automobile market with increasing inexperienced drivers, and put forward the importance of man-machine information interaction analysis. The fuzzy leveler analysis method of accelerating genetic algorithms was used to analyzed the extent of the needs of inexperienced drivers in different situations for different information. It put forward the design ideas which was brought by new LCD display and sensor technology in the process of automobile intelligent development in dashboard design to enhance driving safety. Combined with automobile dashboard interface optimization design example, put forward the corresponding optimization design of dashboard interface based on the results of the analysis.
“Review of Status and Future Prospects of Automotive Intelligent Safety Electronics,”
Based on the definition of automotive intelligent safety electronics, this paper introduced some of the latest technologies and developing trends on the research field home and abroad. Some suggestions for how to research and develop this technology in China have been proposed.
“Crossmodal Interaction of Facial and Vocal Person Identity Information: An Event-Related Potential Study,”
DOI:10.1016/j.brainres.2011.02.021
URL
PMID:21329679
[Cited within: 1]

78 Early interaction between vocal and facial information (<200 ms), 78 structural enconding of person-relevant features, 78 later person-identification processes (>270 ms), 78 person identity node.
“The Neural Network Sustaining the Crossmodal Processing of Human Gender from Faces and Voices: An fMRI Study,”
DOI:10.1016/j.neuroimage.2010.08.073
URL
PMID:20832486
78The visuo-auditory processing of human gender activated unimodal and multimodal regions. 78The unimodal regions are inter-connected via a subcortical relay located in the putamen. 78The left superior parietal gyrus sustained the crossmodal control of attention. 78The right inferior frontal gyrus sustained the integration of unfamiliar face–voice pairs. 78This network does not depend on the task to perform or the cognitive level of processing.
“Interaction of Face and Voice in Status Identification,”
“Rapid Person Identification Method based on Depth Information,”
“Driver Models in Automobile Dynamics Application,”
DOI:10.1080/00423110701432482
URL
[Cited within: 1]
Understanding the driver of an automobile has been attractive to researchers from many different disciplines for more than half a century. On the basis of their acquirements, models of the (human) driver have been developed to better understand, analyse and improve the combined couple of driver and automobile. Due to distinctive demands on the models in accordance with different kinds of applications, a variety of driver models is available. An overview of driver models is given with respect to their application and different methodical modelling approaches. The emphasis is put on the interest of engineers, who generally focus on the automobile (like design and optimization of vehicle components and the overall vehicle dynamics behaviour) by applying their approved (mathematical) methods. Nonetheless, a brief look beyond is added to better complete the view on the involved task of driving and driver modelling for automobile dynamics application.
“Modeling Driver Behavior in Automotive Environments,”
pp.
“The Development of Graphical Automotive Instrument based on QNX Operating System, ”
“Electric Vehicles LCD Instrumentation Design based on emWin,”
“The Development of a Vehicle LCD Dashboard based on Serial Bus,”
“The Analysis of the Cockpit Display Interface’s Color Effects on Novice Drivers’Visual Pre-attentive Progress,”
“The Analysis of Speed Instrument Danger Prompt Effect’s Influence Factors,”
“The Use of Automobile Instrument Desk Background Light Color in the Current Market,”
“The Application of Driver-Oriented Design in the Design of Car Dashboard,”
“Design and Evaluation of an Interactive Proof-of-Concept Dashboard for General Practitioners,”
DOI:10.1109/ICHI.2015.25
URL
[Cited within: 1]
Targeted follow-up meetings in general practice are important and missed often, because of both patient and general practitioners (GPs) related reasons. In this paper, we present a proof-of-concept interactive visualization dashboard that provides GPs with a powerful, yet easy to use method to identify those patients in need of follow-up. We applied a user centered, rapid prototyping methodology with 12 information visualization students and 15 GPs. We evaluated the final design using the evaluation framework by O'Leary et al., as well as a System Usability Scale questionnaire. Results indicate that there is indeed a need for a follow-up tool and that a dashboard is a right kind of tool. Our proof-of-concept shows useful insights into patient records and can indeed help GPs recognize patients in need of follow-up. The major strengths of the design are the ease with which GPs can query patient records using interactive visualizations, such as parallel coordinates, and the ability to check if the number of patients diagnosed with certain diseases differs from the amount predicted in evidence-based guidelines.
