The optimization design problem of customized passenger car cockpits layout is increasingly complexand of growing interest in the Chinesecar market. A new system is proposed to solve this problem based on ergonomic principles. Firstly, based on Kendall’s W, groups and optimization sequences of facilities are determinedusing a combination of Delphi and the analytic hierarchy process. Secondly, the degree of crowdedness in the cockpit layout can be controlled by users’ preference. Thirdly, a particle swarm optimization (PSO) algorithm is adapted to three-dimensional car cockpit layout optimization, and the resulting inertia-adaptive PSO is compared with some typical algorithms to show superiority. Finally, the results are reasonablyanalyzed in ergonomic simulation software. Thus, the proposed platform is demonstrated to be feasible and effective.
Xin Liu. Optimization Design of Customized Passenger Car Cockpit Layout based on Safety Ergonomic Principles. [J], 2019, 15(2): 505-513 doi:10.23940/ijpe.19.02.p15.505513
1. Introduction
Customized servicesare increasingly popular and are becoming the general trend of passenger car cockpit design in China. The conception of the passenger carsconsidered in this articleis based on the definition of GB/T3730.1-2001. As the science and technology incorporated in passenger cars increase, new functions need to be integrated into the cockpit based on customer demands. This may require the cockpitinterior to be reshaped, which refers to the safety ergonomic problems. At present, the layout of a passenger car cockpit mainly depends on the experience of experts and designers. After any modification, an evaluation method is used, but this cannot solve the problem of passenger vehicle designing and development quickly. The cockpit layout optimization problem has received increasing attention. However, only the safety ergonomic theory was applied in the cockpit layout optimization [1-5], thus neglecting drivers’ affective factors. Additionally, most research subjects are non-standard cockpits, such as those of aircraft and submersibles. There is no effective method for solving the problem of passenger car cockpit layout optimization. Thus, an optimization design platform for the customized passenger car cockpit layouts based on safety ergonomic principles is needed.Analytic hierarchy process(AHP) as an evaluation measure has been used in cockpits effectively. In addition, Delphiand AHP have been incorporated in various frameworks to conduct process evaluations[6], with Delphi applied to find the subjectively hierarchical relationships of AHP[7]. In 2009, Delphi and AHP were used in an exploratory study to rank critical success factors contributing to effective quality engineering tools and techniques[8].
There are a number of studies related to the design and optimization of differentcabin or cockpit layoutsusing computational intelligence. In 2001, a genetic algorithm (GA) using human-computer interaction was used to solve the problem of constrained layout optimization[5]. In 2013, a GA was successfully applied to cockpit layout optimization in civil aviation[9]. The same year, a GA and an ant colony algorithm were used to optimize the cockpit layout of a manned submersible[1-2]. However, PSO is easier and more efficient than the evolutionary algorithms mentioned above. PSOis a population-based stochastic optimization technique that was developed by[10]. In 2007, PSO was used to solve the multiple-level warehouse layout design problem [11]. In 2011, Kulturel-Konak successfully used PSO to solve the engineering problem for the layout of unequal area facilitieswith a flexible bay structure,which is a very commonlayout in manufacturing and retail facilities[12]. In 2012, PSO was applied to optimize the layout of a vertical channel in a ship’s hull [7]. Thus, PSO is known to be effective in solving complex engineering layout problems. Although the PSO algorithm has been successfully applied to different industrial areas and different engineering problems, relatively few applications have considered the layout design of cabins or cockpits. The optimization of a cockpit layout considers how facilitiescan be arranged more appropriately within a limited space. The cockpit layout optimization problem can be divided into two-dimensional and three-dimensional layout optimization problems[13]. In 2003, PSO was first used to solve the two-dimensional layout optimization of round facilities in a satellite cabin[14]. The following year, PSO was applied to solve the two-dimensional layout optimization problem of cube-like facilities in a rotation module [15]. However, PSO has been rarely usedto solve three-dimensional cockpit layout optimizationproblems[16], especially the problem of car cockpit layouts.
The remainder of this paper is organized as follows. In Section 2, our method foran optimal design platform is introduced. We first describe the workflow for establishing the platform, and then describe how to determine the optimization sequence and importance of facilities in Chinese passenger carsusing Delphi-AHP. Next, weexplain howto optimize the layoutusing an inertia-adaptive particle swarm optimization (PSO)algorithm based on ergonomic theory and the degree of crowdedness desired by the user. Section 3describes the implementation of the algorithm and presents some examples. These simulations demonstrate the feasibility and effectiveness of the proposed technique.
2. Optimal Design Platform
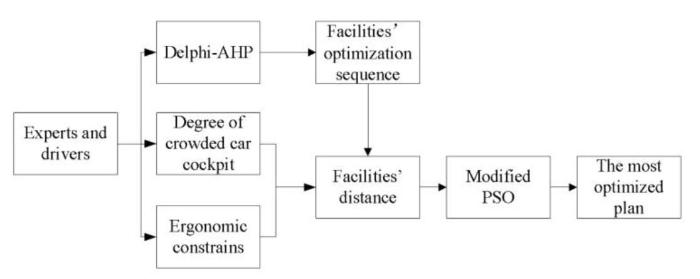
The facilities optimization depends on the Delphi-AHP analyses, and the optimal plan depends on the modified PSO analyses. The workflow of the optimal design platform is shown in Figure 1.
Figure 1.
Workflow of the proposed optimal design platform
2.1. Using Delphi-AHP to Determine Rankings and Weights for Car Cockpit Facilities
2.1.1. Determination of Mean Rankings
It is important to determine the list of experts involved in the Delphi process. The experts should have considerable knowledge about the major operational experiences. According to the research needs, around 10-18 specialists should be consulted. Facilities in passenger cars are classified by the experts and customers. Then, the facilities groups are ordered by importance, with the choices made by experts dominated by those of the customers to some extent. The consultation platform is established over the internet. Based on the principles of being scientific, comprehensive, systematic, significant, and feasible, the customers and specialists’complete questionnaires on the internet, and then statistical processing is carried on repeatedly until a consensus is reached. It is assumed that the hth criterion level has k optimization indexes B1h, B2h,…,Bkh. The optimization index system of the hth criterion level is Bh={B1h, B2h, …, Bkh}, and the next level of Bjh can be subdivided into Bjh+1={Bj1h+1, Bj2h+1, …, Bjnh+1}, where j =1,2, …,kand h, k, n$\in $N+.
Becausethe data analysis is related to the diversity, as suggested by [17], the consensus among the rankings was measured using Kendall’s W.
According to theP experts’ rankings, thefacilitiesare ranked1, 2, …, kin order of importance, from low to high. In addition, B1h,B2h,…,Bkhare the ranking numbers inthehthhierarchy. The hypotheses for testing are then:
Where p is the number of experts,k is the number of facilities,and Rj is the sum of the rank order numbers from facility j.If two or more items are assigned the same rank order by the experts, Kendall’s W is given by:
Where tis thenumber of items with the same rank order.The chi-squared value is then calculated as:
${{\chi }^{2}}=p(k-1)W$
According to the number of degrees of freedom, $\nu =k-1$, and the chi-squared test should be conducted to confirm whether the ranking is consistent. If ${{\chi }^{2}}_{_{0.05,k-1}}<{{\chi }^{2}}$, $P<0.5$, and H0 can be rejected; thus, H1 is accepted, which means that the level of consensus among the experts is high.
1.1.2. Weights Calculated by Delphi-AHP
AHP can be improved by applying the Delphi process. As the matrix-based Delphi ranking is consistent, many steps of the associated consistency tests are unnecessary. The judgment matrixfor the lowest criterion level can be written as:
Because Bh is a consistent matrix, the rank of Bh is 1. The unique nonzero characteristic value of Bh is k, and the normalized eigenvector of Bh can be used as the weight vector according to:
Bhw=kw, w=(w1,w2,…,wk)
After normalizingw, the relative importance of the criteria at the lowest criterion level is given by[18]:
2.2. Layout Optimization Problem Solved by Inertia-Adaptive PSO
2.2.1. Theory ofInertia-Adaptive PSO
In PSO, each single solution is a particle in the search space. All particles have fitness values that are evaluated by a fitness function and velocities that determine their direction within the search space. The particles move through the problem space by following the current optimum particles[19]. PSO is modified by the inertia-adaptive factor to improve the global search ability and prevent becoming trapped around local optima. The inertia-adaptive factor is given by:
Where ${{w}_{\max }}$ and ${{w}_{\min }}$ are the maximum and minimum values of $w$, respectively, and $f$is the objective function of the current particle position. ${{f}_{avg}}$ and ${{f}_{\min }}$ are the average and minimum values of the current particle position, respectively, so the inertial factor adjusts itself adaptively according to the particle trajectory. When the values of the current particle positions are uniform, the value of $w$ increases; otherwise, when the values of the current particle positions are dispersed, the value of $w$ decreases.In this way, the inertia-adaptive factor encourages the particles to come together and exploit a potential optimum point.
2.2.2. Establishment of the Objective Function
Based on ergonomict heory, the positional relationships among facilities in passenger car interiors require several targets to be optimized, i.e., ergonomic layout optimization is a multi-objective optimization problem. The approach of linear scalarization, which can convert multi-objective optimization problems into single-objective optimization problems, can be written as:
Where ${{w}_{i}}$ is the weight of the objective($0{{w}_{i}}1$, $\sum\limits_{i=1}^{n}{{{w}_{i}}=1}$) and D is the feasible solution set.
2.2.3. Ergonomic Constraints of Facilities Layout Optimization
According to the standard of the Society of Automotive Engineers, drivers of different statures can adjust the driving seat to the desired position in the car. Hence, the distribution of drivers’ eye positions will form an ellipse when they are seated in a relaxed manner. To achieve a definite optimization scheme, the eye position is simplified to be at the axis of the ellipse, which means the driver has the seat fixed at the middle of its adjustable range. In addition, the origin of the coordinates in the proposed framework is the point midway between the driver’s eyes.
Visual field constraints of human eyes: The angle of viewis formed by two light rays running from the two end points of the facilityto the eyeball. The size of this field of view is determined by the distance from the eyeball to the facility and the distance between the two end points of the facility. The angle of view can be calculated as follows:
Where $\alpha $represents the angle of view from facility i to facility j.$({{x}_{i}},{{y}_{i}},{{z}_{i}})$ are the areal coordinates of facility i,and $({{x}_{k}},{{y}_{k}},{{z}_{k}})$ are the areal coordinates of facilityk. The maximum horizontal view angle of the human eye is 156°, and the maximum horizontal view angle of both eyes together is 188°. In this case, the angle of the over lapping space is 124°, and the comfortable view angle of one eye is 60°[20].
Reachable workspace constraint: Customer groups with different size standards are now analyzed comprehensively. The model for what facilities are reachable by the driver’s hands is given by Equation(10) and Equation(11). Customer stature data can be measured using a 3D scanning device.
In Equation(10) and Equation(11), the origin of the coordinate scheme is the center of the driver’s eyes.S denotes the shoulder width, E is the horizontal distance from the eye to the shoulder along the y-axis direction, L is the vertical distance from the eye to the shoulder, and T is the distance from the outside of the shoulder to the articulatio humeri.r is the radius of a circle formed by the human arm’s normal attainable region.R1,R2, and R3 are the axis lengthsof the ellipsoid formed by the human arm’s maximum attainable regionin the x-axis,y-axis, andz-axis directions, respectively.
Non-interference boundary constraints of the facilities: The distance between two central points on two different facilities respectively should be greater than or equal to half of the sum of the lengths, widths, and heights of the two facilities, so the two facilities will not overlap with each other.
In Equation (12), $({{x}_{i}},{{y}_{i}},{{z}_{i}})$ are the areal coordinates of facility i, and ${{a}_{i}}$,${{b}_{i}}$, and ${{c}_{i}}$ are the length, width, and height of facility i, respectively. Similarly, $({{x}_{j}},{{y}_{j}},{{z}_{j}})$ are the areal coordinates of facility j, and ${{a}_{j}}$, ${{b}_{j}}$, and ${{c}_{j}}$ are the length, width, and height of facility j, respectively.
2.2.4. Degree of Crowdedness of Car Cockpit as Determined by User
The semantic differential (SD) method can be used to extract user-centered emotional opinions[21]. To measure user attitudes to the degree of crowdedness in car cockpits[17], the semantic differential scale shown in Figure 2 was used to record the opinions of users. The relationship between the crowdedness in the car and the recorded figures can then be analyzed using least-squares multiple regression.
Nine experts with considerable experienceand knowledge of theoretical principles were invited to join the consultation. A female customer completed the consultation platform before the experts, so that the customer results could be used as a reference. Among the nine experts, there were four passenger car designers, three common passenger car drivers, and two car mechanics. One expert was less than 30 years old, three were aged 30-40, two were aged 40-50, and three were older than 50. In addition, three experts had 5-10 years driving experience, three had 10-15 years of driving experience, and three had more than 15 years of driving experience.
Using the items in Table 1, the customer and nine experts ordered the items of criteria level B1 in order of importance, from 1 (least important) to k (most important). According tothese rankings, the Kendall’s $W=0.797$, giving $\chi _{0.05,7}^{2}=14.067$ and $\chi _{0.05,7}^{2}{{\chi }^{2}}=55.758$. Thus, the ranking values were consistent. This result was achieved by the second round, because the values inthe first round were inconsistent. In addition, the items in different criteria levels should be rearranged until the ranking values are consistent. Hence, the approximate optimization sequence in criteria level B1was found to be B11,B21,B61,B31,B51,B41,B81,B71. Owing to the variety of facilities, the sequences can be adjusted some what during the process of optimization. Based on Delphi-AHP, the sequences and weights of all items can then be calculated.
Because the customer was sensitive about the degree of crowdedness in the cockpit, more surveys were conducted. A total of 203 questionnaires were sent and collected, with data from 119 considered to be usable. Based onleast-squares multiple regression, the relationship between the degree of crowdedness in car cockpits and the customer satisfaction was found to be:
In Table 1 and Equation(13), the dependent variable S is the semantic differential scale value givenby the user, and the dependent variable A is the ratio between the user’s ideal distance and the minimum distance among the facilities in the car. The number of observations was 119,F(3,115)=92.26, Prob>F=0.0000, and R2=0.7065. These statistics indicate that the results are ideal.
From an ergonomic perspective, there is a most suitable distance between two facilities or the car bulkhead, but not all facilities can be placed in their optimal positions. Thus, the facilities must be arranged to form the most satisfactory integral layout. The objective function $f_{x}$ was constructed based on this idea. Using the minimum Euclidean distance, Equation(9) was computed to determine the viewing angles formed among different related facilities. Therefore, as an objective function, we seek to minimize:
The constraints for Equation (14) are given by Equation (11) and Equation (12). In Equation(14), $({{x}_{i}},{{y}_{i}},{{z}_{i}})$ are the coordinates of a point on facility i, and similarly for subscripts j and k. The selected points on those facilities are determined by the optimization objective. Facility j is normally close to facilityi, not with standing the non-interference boundaries, or they are related with each other in terms of the driving process. They maybe in the same group, but the optimization sequence of facility j is behind that of facility i. oijis the optimal distance between the points on facility i and those on facility j according to the theory of ergonomics. Based on driving requirements, facility i and facility j should have an appropriate viewing angle. A is the ratio between the user’s ideal distance and the minimum distance among the facilities in the car.
When $S=2,A=1.865$, the optimal values of the handbrake’s central point can be found using the optimal design platform. For example, the coordinates of the multi-function steering wheel, gearstick, chair, and storage box are known. The coordinates of the multi-function steering wheel’s central point are $k=(0\text{mm},362.2\text{mm},\text{-}289.8\text{mm})$. The coordinates of the gearstick when pushed backward to its endpoint are ${{j}_{1}}=(391.2\text{mm},236.5\text{mm},\text{-}565.1\text{mm})$, and those of the chair’s central point are $~{{j}_{2}}=(0\text{mm, 65}\text{.2mm, -753}\text{.4mm})$. The central point of the storage box is located at ${{j}_{3}}=(391.2\text{mm,-101}\text{.4mm,-586}\text{.8mm})$. Based on the facilities ranked by the customer and nine experts in order of importance by Delphi-AHP, the mean rankings and weights can be obtained(see Table 2). The Kendall’s W=0.834 and ${{\chi }^{2}}_{_{0.05,9}}=16.919\text{ }<{{\chi }^{2}}=67.573$, which means that the ranking values are consistent.
Table 2
Table 2.Mean rankings and weightsfrom the customer and nine experts
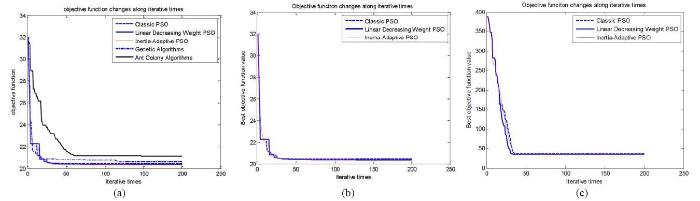
To demonstrate the superiority of the proposed inertia-adaptive PSO, we compared the optimization results with those given by the classic PSO, linear decreasing weight PSO, GA, and ant colony optimization. The parameter values for each algorithm were as follows: in classic PSO, the learning factors were set to 2, the weight values were set to 1.1, and the number of particles was 50. In linear decreasing weight PSO, the learning factors were set to 2, the maximum weight was 1.1, and the number of particles was set to 50. The GA had a size of 50, crossover probability of 1.1, and a mutation probability of 0.7. In the ant colony optimization algorithm, the size was set to 50.In the proposed inertia-adaptive PSO, the learning factors were set to 2 and the number of particles was 50. The inertia weights have been recommended from 1.4 to 0 and have good performance[6]; thus, the maximum weight was set to 1.1 and the minimum weight was set to 0.7 to ensure satisfactory solutions. The results are presented in Table 3 and Figure 3(a). The minimum values given by the ant colony optimization algorithm are always unsatisfactory and become stuck around local optima; the GA always has lower efficiency than the other algorithms, because it requires more steps for the cross over and mutation operations. In Figure 3(b), not only is the efficiency of inertia-adaptive PSO slightly higher than that of classic PSO and linear decreasing weight PSO, but the minimum value found by the proposed approach is slightly smaller than those given by the classic and linear decreasing weight PSO methods. In Figure 3(c), the minimum value found by inertia-adaptive PSO is again slightly smaller than that found by the classic and linear decreasing weight approaches. Thus, the inertia-adaptive PSO is the best method for solving this problem.
Taking another example of the air conditioner panel, the coordinates of the point on the multi-function steering wheel fixed with the bulkhead are (0mm,508.6mm,-239.8mm), the endpoint of the gearstick when pushed forward to its furthest extent is (391.2mm, 340mm, -565.1mm),the point on the center of the multimedia display and control panel is(316.0mm,473.1mm,-269.6mm), and the point on the bottom center of the windscreen is (403.6mm, 887.1mm,-221.8mm). In this case, the coordinates of the air conditioner control panel center can be obtainedas (315.1926mm,395.3068mm,-189.2221mm).
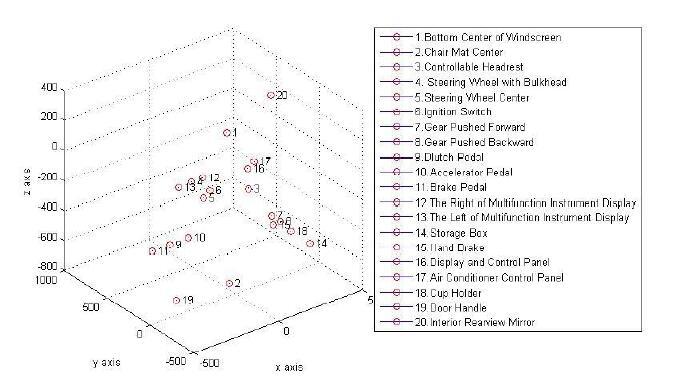
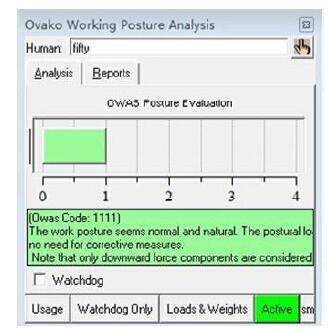
As shown in Figure 4, the optimized positions of the 20 most important facilities are shown. According to the physical truth, optimized positions of facilities are needed to be adjusted properly. The optimized layout scheme is analyzed by the simulation software JACK as Figure 5. All of the facilities are in the proper visual fields and reach zones.
Figure 5.
Analysis of visual fields, reach zones, and comfort assessment using JACK
4. Conclusions
This paper has described an optimal design platform for the layout of a car’s cockpit. Using the optimal design platform, the limited workspace can be used efficiently and drivers can drive more safely, feel comfortable for a longer time, and reduce their effort. Additionally, the optimal design platform reduces the probability of drivers becoming fatigued, which reduces the likelihood of poor driving and incorrect operations.
To analyze the space layout problem for passenger vehicle cockpits, a combined AHP-Delphi process has been proposed. As the optimization process is difficult because of the many facilities to be arranged, the conventional AHP was adapted and improved using Delphi.
To prevent candidate solutions from becoming trapped around local optima in the optimization process,the inertia-adaptive PSO algorithm, which has fewer parameters and a higher degree of accuracy than conventional PSO, was applied to optimize the ergonomic layout of a car’s cockpit in three dimensions. The modified layout was then compared with those given by several other optimization algorithms. The results demonstrate that the proposed approach provides a reasonable layout. The inertia-adaptive PSO algorithm combined with Delphi-AHP can solve the optimization design problem of customizing the safety ergonomic layout of passenger car cockpits in three-dimensional space effectively and efficiently.
Acknowledgments
This research is partially supported by the Guangzhou University Teaching Reform Project of Creative Product Design in Interactive Experience (09-18ZX0304)and the Guangzhou University Teaching Reform Project of 09-18ZX0309.
Scheme design and packing problems with behavioral constraints (inertia, balance, stability and vibration etc.) and constrained layout optimization problems belong to NPC. They are concerned more and more in recent years and arise in a variety of application areas such as the layout design of spacecraft, shipping, vehicle, machine tool, and robot etc. Taking the layout design of artificial satellite cabins as background, a human computer interactive genetic algorithm is proposed for solving the two dimensional constrained layout optimization problems in this paper. Firstly, the algorithm makes the artificial individuals (AIs) as a part of the chromosome population and divides the population into some subgroups. Secondly, each subgroup, whose values of crossover and mutation operators are different from other subgroups, operates independently. After copy, crossover, and mutation operations, the better individual in each subgroup is transferred to adjacent subgroups. Thirdly, human expert examines the locally optimal solution that can be obtained through the loops of many generations and designs new AIs with visualized technology. By the way, he finds these new AIs according to the value of fitness function, then to many actual engineering factors. Finally these new AIs are copied in order to ensure that they play an important role in chromosome population. Then they are placed into the chromosome population to replace the worse individuals. The four steps mentioned above are repeated until the human expert finds the satisfied solution. And then human computer interactive genetic algorithm is formed to solve the practical engineer layout problems and the specialties of human and computer can be exerted to the utmost respectively. The results of three examples(one of them is proposed by the authors, and its optimal solution is known)show that this algorithm is feasible and efficient. The human computer interactive genetic algorithm provides an effective approach for the practically complex layout problems in engineering, as well as for the problems of maneurerability of human computer interaction.
Y.Shi and R. C.Eberhart,
“Parameter Selection in Particle Swarm Optimization,”
in Proceedings of International Conference on Evolutionary Programming,pp. 591-600, Springer, Berlin, Heidelberg, 1998
The passage plays a vital role in operation and maintenance of naval ships. The rational design of the passage could increase the efficiency of combat logistics, life-cycle logistics and personnel movement under combat and emergency conditions. Borrowing ideas from facility layout, the model of optimal vertical passage layout was established to formulation the vertical passage layout problem. The Floyd090005s algorithm was used to calculate the distance between two compartments and the particle swarm optimization algorithm was proposed to solve the mathematical model. From simulation results, the model and methods are feasible for the vertical passage layout problem.
N.T.Putri and S. M. Yusof ,
“Critical Success Factors for Implementing Quality Engineering Tools and Techniques in Malaysia and Indonesia’s Automotive Industries: An Exploratory Study,”
in Proceedings of the International Multi-Conference of Engineers and Computer Scientists,Vol. 2, pp.18-20, 2009
Warehouse operation and management is one of the essential parts of manufacturing and service operations. The warehouse layout problem is a key to warehouse operations. Generally, warehouse layout design models attempt to optimize different objectives such as the orientation of storage racks, the allocation of space among competing uses, the number of cranes, the overall configuration of the facility, etc. The warehousing strategies can be classified as distribution-type, production-type and contract-type warehouse strategies. In this study, a distribution-type warehouse considered that various type products are collected from different suppliers for storing in the warehouse for a determined period and for delivery to different customers. The aim of the study is to design a multiple-level warehouse shelf configuration which minimizes the annual carrying costs. The turnover rates of the products are classified and they are considered while putting/picking them to/from shelves regarding the distances between the shelves and docks. Since proposed mathematical model was shown to be NP-hard, a particle swarm optimization algorithm (PSO) as a novel heuristic was developed for determining the optimal layout.
S.Kulturel-Konak and A.Konak,
“A New Relaxed Flexible Bay Structure Representation and Particle Swarm Optimization for the Unequal Area Facility Layout Problem,”
The facility layout problem (FLP) with unequal area departments is a very hard problem to be optimally solved. In this article, a hybrid particle swarm optimization (PSO) and local search approach is proposed to solve the FLP with unequal area departments. The flexible bay structure (FBS), which is a very common layout in manufacturing and retail facilities, is used. Furthermore, the FBS is relaxed by allowing empty spaces in bays, which results in more flexibility while assigning departments in bays. The proposed PSO approach is used to solve the FLP instances from the literature with varying sizes. The comparative results show that the PSO approach is very promising and able to find the previously known-optimal solutions in very short CPU times. In addition, new best solutions have been found for some test problems. Improvements have been achieved by allowing partially filled bays.
Y.Li, B.Zheng, Z.Dai,
“General Particle Swarm Optimization based on Simulated Annealing for Multi-Specification One-Dimensional Cutting Stock Problem,”
in Proceedings of International Conference on Computational and Information Science, Springer, Berlin, Heidelberg, 2006
In this paper a general particle swarm optimization based on simulated annealing algorithm (SA-GPSO) for the solution to multi-specification one-dimensional cutting stock problem is proposed. Due to t
F.Liu, M.Sun, N.Li, D.Sun, T.Zou,
“Particle Swarm Optimization and its Application of Constrained Layout Optimization,”
Computer Engineering and Applications, No. 12, pp.71-93, 2004
This study measured 21 anthropometric dimensions (ADs) of 94 Korean male helicopter pilots in their 20s to 40s and compared them with corresponding measurements of Korean male civilians and the US Army male personnel. The ADs and the sample size of the anthropometric survey were determined by a four-step process: (1) selection of ADs related to helicopter cockpit design, (2) evaluation of the importance of each AD, (3) calculation of required sample sizes for selected precision levels and (4) determination of an appropriate sample size by considering both the AD importance evaluation results and the sample size requirements. The anthropometric comparison reveals that the Korean helicopter pilots are larger (ratio of means=1.011.08) and less dispersed (ratio of standard deviations =0.710.93) than the Korean male civilians and that they are shorter in stature (0.99), have shorter upper limbs (0.890.96) and lower limbs (0.930.97), but are taller on sitting height, sitting eye height and acromial height (1.011.03), and less dispersed (0.680.97) than the US Army personnel.Practitioner summary: The anthropometric characteristics of Korean male helicopter pilots were compared with those of Korean male civilians and US Army male personnel. The sample size determination process and the anthropometric comparison results presented in this study are useful to design an anthropometric survey and a helicopter cockpit layout, respectively.
K. S.Shen, K. H.Chen, C. C.Liang, W. P.Pu, M. Y.Ma,
“Measuring the Functional and Usable Appeal of Crossover B‐Car Interiors,”
Human Factors and Ergonomics in Manufacturing & Service Industries,Vol. 25, No. 1, pp. 106-122, 2015
As the number of new products developed by new technologies has increased, the importance of the commercialization of new technology products has become crucial to manufactures in the successful delivery of valuable new products and services. This study classified success factors for commercialization of new products and analyzed which factors should be primarily considered. Based on the literature review and Delphi method, we identified four decision areas and further prioritized the sixteen factors under a hierarchy model structured by fuzzy AHP (analytic hierarchy process) approach. The FAHP is conducted by 111 R&D and business experts working at the world's major players in machinery industry; using the priorities of success factors derived by FAHP, we devise an example of commercialization assessment model. The paper drives the assessment initiatives of the new product development in manufactures and provides them with practical implications about the commercialization of new technology product. (c) 2013 Elsevier Ltd. All rights reserved.
M.N.Rahman and M. A. Matin ,
“Efficient Algorithm for Prolonging Network Lifetime of Wireless Sensor Networks,”
One of the fundamental design challenges in designing a Wireless Sensor Network (WSN) is to maximize the network lifetime, as each sensor node of the network is equipped with a limited power battery. To overcome this challenge, different methods were developed in the last few years using such techniques as network protocols, data fusion algorithms using low power, energy efficient routing, and locating optimal sink position. This paper focuses on finding the optimal sink position. Relay nodes are introduced in conjunction with the sensor nodes to mitigate network geometric deficiencies since in most other approaches the sensor nodes close to the sink become heavily involved in data forwarding and, thus, their batteries are quickly depleted. A Particle Swarm Optimization (PSO) based algorithm is used to locate the optimal sink position with respect to those relay nodes to make the network more energy efficient. The relay nodes communicate with the sink instead of the sensor nodes. Tests show that this approach can save at least 40% of the energy and prolong the network lifetime.
X.Liu, S. H.Yu, T. C.Gong, Q.Zhang, M. L.Zhao, W. Y.Zhang,
“Ergonomics Layout Optimization of the Aircraft Cockpit based on Particle Swarm Optimization,”
The problem of neglecting ergonomic factors on the aircraft cockpit layout design which leads to the pilots feeling tired very soon should be solved imminently. Since there are a lot of ergonomic constraints while there are hardly any algorithms to solve the problem, the particle swarm optimization is mentioned. Firstly, ergonomic geometric constraints and ergonomic space constraints are confirmed. Secondly, the objective function is confirmed based on the minimum Euclidean distance. Thirdly, to avoid local optimum, particle swarm optimization is used to find the best coordinate values of facilities. At last, the best values of different facilities are needed to be compromised by each other to confirm the most proper values for every facility and form the optimal scheme of designing the layout of aircraft cockpits.
F.Guo, W. L.Liu, Y.Cao, F. T.Liu, M. L.Li,
“Optimization Design of a Webpage based on Kansei Engineering,”
Human Factors and Ergonomics in Manufacturing & Service Industries,Vol. 26, No. 1, pp.110-126, 2016
“Ant Colony Algorithm for Human-Machine Layout Optimization,”
2
2013
... Customized servicesare increasingly popular and are becoming the general trend of passenger car cockpit design in China. The conception of the passenger carsconsidered in this articleis based on the definition of GB/T3730.1-2001.As the science and technology incorporated in passenger cars increase, new functions need to be integrated into the cockpit based on customer demands.This may require the cockpitinterior to be reshaped, which refers to the safety ergonomic problems.At present, the layout of a passenger car cockpit mainly depends on the experience of experts and designers. After any modification, an evaluation method is used, but this cannot solve the problem of passenger vehicle designing and development quickly. The cockpit layout optimization problem has received increasing attention. However, only the safety ergonomic theory was applied in the cockpit layout optimization [1-5], thus neglecting drivers’ affective factors. Additionally, most research subjects are non-standard cockpits, such as those of aircraft and submersibles. There is no effective method for solving the problem of passenger car cockpit layout optimization. Thus, an optimization design platform for the customized passenger car cockpit layouts based on safety ergonomic principles is needed.Analytic hierarchy process(AHP) as an evaluation measure has been used in cockpits effectively. In addition, Delphiand AHP have been incorporated in various frameworks to conduct process evaluations[6], with Delphi applied to find the subjectively hierarchical relationships of AHP[7]. In 2009, Delphi and AHP were used in an exploratory study to rank critical success factors contributing to effective quality engineering tools and techniques[8]. ...
... There are a number of studies related to the design and optimization of differentcabin or cockpit layoutsusing computational intelligence. In 2001, a genetic algorithm (GA) using human-computer interaction was used to solve the problem of constrained layout optimization[5]. In 2013, a GA was successfully applied to cockpit layout optimization in civil aviation[9]. The same year, a GA and an ant colony algorithm were used to optimize the cockpit layout of a manned submersible[1-2]. However, PSO is easier and more efficient than the evolutionary algorithms mentioned above. PSOis a population-based stochastic optimization technique that was developed by[10]. In 2007, PSO was used to solve the multiple-level warehouse layout design problem [11]. In 2011, Kulturel-Konak successfully used PSO to solve the engineering problem for the layout of unequal area facilitieswith a flexible bay structure,which is a very commonlayout in manufacturing and retail facilities[12]. In 2012, PSO was applied to optimize the layout of a vertical channel in a ship’s hull [7]. Thus, PSO is known to be effective in solving complex engineering layout problems. Although the PSO algorithm has been successfully applied to different industrial areas and different engineering problems, relatively few applications have considered the layout design of cabins or cockpits. The optimization of a cockpit layout considers how facilitiescan be arranged more appropriately within a limited space. The cockpit layout optimization problem can be divided into two-dimensional and three-dimensional layout optimization problems[13]. In 2003, PSO was first used to solve the two-dimensional layout optimization of round facilities in a satellite cabin[14]. The following year, PSO was applied to solve the two-dimensional layout optimization problem of cube-like facilities in a rotation module [15]. However, PSO has been rarely usedto solve three-dimensional cockpit layout optimizationproblems[16], especially the problem of car cockpit layouts. ...
“Research on 3D Layout Optimization of HOV Cabin,”
1
2013
... There are a number of studies related to the design and optimization of differentcabin or cockpit layoutsusing computational intelligence. In 2001, a genetic algorithm (GA) using human-computer interaction was used to solve the problem of constrained layout optimization[5]. In 2013, a GA was successfully applied to cockpit layout optimization in civil aviation[9]. The same year, a GA and an ant colony algorithm were used to optimize the cockpit layout of a manned submersible[1-2]. However, PSO is easier and more efficient than the evolutionary algorithms mentioned above. PSOis a population-based stochastic optimization technique that was developed by[10]. In 2007, PSO was used to solve the multiple-level warehouse layout design problem [11]. In 2011, Kulturel-Konak successfully used PSO to solve the engineering problem for the layout of unequal area facilitieswith a flexible bay structure,which is a very commonlayout in manufacturing and retail facilities[12]. In 2012, PSO was applied to optimize the layout of a vertical channel in a ship’s hull [7]. Thus, PSO is known to be effective in solving complex engineering layout problems. Although the PSO algorithm has been successfully applied to different industrial areas and different engineering problems, relatively few applications have considered the layout design of cabins or cockpits. The optimization of a cockpit layout considers how facilitiescan be arranged more appropriately within a limited space. The cockpit layout optimization problem can be divided into two-dimensional and three-dimensional layout optimization problems[13]. In 2003, PSO was first used to solve the two-dimensional layout optimization of round facilities in a satellite cabin[14]. The following year, PSO was applied to solve the two-dimensional layout optimization problem of cube-like facilities in a rotation module [15]. However, PSO has been rarely usedto solve three-dimensional cockpit layout optimizationproblems[16], especially the problem of car cockpit layouts. ...
“The Ergonomic Cockpit Interior Design and Evaluation Methods Driven by Hybrid Kansei Engineering,
0
2016
“The Construction of the Ergonomics Criteria Framework in Civil Aircraft Cockpit Design,”
0
2014
“Human-Computer Interactive Genetic Algorithm and its Application to Constrained Layout Optimization,”
2
2001
... Customized servicesare increasingly popular and are becoming the general trend of passenger car cockpit design in China. The conception of the passenger carsconsidered in this articleis based on the definition of GB/T3730.1-2001.As the science and technology incorporated in passenger cars increase, new functions need to be integrated into the cockpit based on customer demands.This may require the cockpitinterior to be reshaped, which refers to the safety ergonomic problems.At present, the layout of a passenger car cockpit mainly depends on the experience of experts and designers. After any modification, an evaluation method is used, but this cannot solve the problem of passenger vehicle designing and development quickly. The cockpit layout optimization problem has received increasing attention. However, only the safety ergonomic theory was applied in the cockpit layout optimization [1-5], thus neglecting drivers’ affective factors. Additionally, most research subjects are non-standard cockpits, such as those of aircraft and submersibles. There is no effective method for solving the problem of passenger car cockpit layout optimization. Thus, an optimization design platform for the customized passenger car cockpit layouts based on safety ergonomic principles is needed.Analytic hierarchy process(AHP) as an evaluation measure has been used in cockpits effectively. In addition, Delphiand AHP have been incorporated in various frameworks to conduct process evaluations[6], with Delphi applied to find the subjectively hierarchical relationships of AHP[7]. In 2009, Delphi and AHP were used in an exploratory study to rank critical success factors contributing to effective quality engineering tools and techniques[8]. ...
... There are a number of studies related to the design and optimization of differentcabin or cockpit layoutsusing computational intelligence. In 2001, a genetic algorithm (GA) using human-computer interaction was used to solve the problem of constrained layout optimization[5]. In 2013, a GA was successfully applied to cockpit layout optimization in civil aviation[9]. The same year, a GA and an ant colony algorithm were used to optimize the cockpit layout of a manned submersible[1-2]. However, PSO is easier and more efficient than the evolutionary algorithms mentioned above. PSOis a population-based stochastic optimization technique that was developed by[10]. In 2007, PSO was used to solve the multiple-level warehouse layout design problem [11]. In 2011, Kulturel-Konak successfully used PSO to solve the engineering problem for the layout of unequal area facilitieswith a flexible bay structure,which is a very commonlayout in manufacturing and retail facilities[12]. In 2012, PSO was applied to optimize the layout of a vertical channel in a ship’s hull [7]. Thus, PSO is known to be effective in solving complex engineering layout problems. Although the PSO algorithm has been successfully applied to different industrial areas and different engineering problems, relatively few applications have considered the layout design of cabins or cockpits. The optimization of a cockpit layout considers how facilitiescan be arranged more appropriately within a limited space. The cockpit layout optimization problem can be divided into two-dimensional and three-dimensional layout optimization problems[13]. In 2003, PSO was first used to solve the two-dimensional layout optimization of round facilities in a satellite cabin[14]. The following year, PSO was applied to solve the two-dimensional layout optimization problem of cube-like facilities in a rotation module [15]. However, PSO has been rarely usedto solve three-dimensional cockpit layout optimizationproblems[16], especially the problem of car cockpit layouts. ...
2
1998
... Customized servicesare increasingly popular and are becoming the general trend of passenger car cockpit design in China. The conception of the passenger carsconsidered in this articleis based on the definition of GB/T3730.1-2001.As the science and technology incorporated in passenger cars increase, new functions need to be integrated into the cockpit based on customer demands.This may require the cockpitinterior to be reshaped, which refers to the safety ergonomic problems.At present, the layout of a passenger car cockpit mainly depends on the experience of experts and designers. After any modification, an evaluation method is used, but this cannot solve the problem of passenger vehicle designing and development quickly. The cockpit layout optimization problem has received increasing attention. However, only the safety ergonomic theory was applied in the cockpit layout optimization [1-5], thus neglecting drivers’ affective factors. Additionally, most research subjects are non-standard cockpits, such as those of aircraft and submersibles. There is no effective method for solving the problem of passenger car cockpit layout optimization. Thus, an optimization design platform for the customized passenger car cockpit layouts based on safety ergonomic principles is needed.Analytic hierarchy process(AHP) as an evaluation measure has been used in cockpits effectively. In addition, Delphiand AHP have been incorporated in various frameworks to conduct process evaluations[6], with Delphi applied to find the subjectively hierarchical relationships of AHP[7]. In 2009, Delphi and AHP were used in an exploratory study to rank critical success factors contributing to effective quality engineering tools and techniques[8]. ...
... To demonstrate the superiority of the proposed inertia-adaptive PSO, we compared the optimization results with those given by the classic PSO,linear decreasing weight PSO,GA, and ant colony optimization.The parameter values for each algorithm were as follows:in classic PSO, the learning factorswere set to 2, the weight values were set to 1.1, and the number of particles was 50.Inlinear decreasing weight PSO, the learning factors were set to 2, the maximum weight was 1.1,and the number of particles was set to 50.The GA had a size of 50, crossover probability of 1.1, and a mutationprobability of 0.7.In the ant colonyoptimization algorithm, the size was set to 50.In the proposed inertia-adaptive PSO, the learning factorswere set to 2and the number of particles was 50.The inertia weightshave been recommended from 1.4 to 0 and have good performance[6];thus, the maximum weight was set to 1.1 and the minimum weight was set to 0.7to ensure satisfactory solutions. The results are presented in Table 3 and Figure 3(a).The minimum values given by the ant colony optimization algorithm are always unsatisfactory and become stuck around local optima; theGA always has lowerefficiency than the other algorithms,because it requires more steps for the crossover and mutation operations. In Figure 3(b),not onlyis the efficiency of inertia-adaptive PSOslightlyhigher thanthat of classic PSO and linear decreasing weightPSO,but the minimum value found by the proposed approach is slightly smaller than those given by the classic andlinear decreasing weightPSO methods. In Figure3(c), the minimum value found by inertia-adaptive PSO is again slightly smaller than that found bythe classic and linear decreasing weightapproaches. Thus, the inertia-adaptive PSO is the best method for solving this problem. ...
“Particle Swarm Optimization based Algorithm for Ship Vertical Passage Layout Optimization,”
2
2012
... Customized servicesare increasingly popular and are becoming the general trend of passenger car cockpit design in China. The conception of the passenger carsconsidered in this articleis based on the definition of GB/T3730.1-2001.As the science and technology incorporated in passenger cars increase, new functions need to be integrated into the cockpit based on customer demands.This may require the cockpitinterior to be reshaped, which refers to the safety ergonomic problems.At present, the layout of a passenger car cockpit mainly depends on the experience of experts and designers. After any modification, an evaluation method is used, but this cannot solve the problem of passenger vehicle designing and development quickly. The cockpit layout optimization problem has received increasing attention. However, only the safety ergonomic theory was applied in the cockpit layout optimization [1-5], thus neglecting drivers’ affective factors. Additionally, most research subjects are non-standard cockpits, such as those of aircraft and submersibles. There is no effective method for solving the problem of passenger car cockpit layout optimization. Thus, an optimization design platform for the customized passenger car cockpit layouts based on safety ergonomic principles is needed.Analytic hierarchy process(AHP) as an evaluation measure has been used in cockpits effectively. In addition, Delphiand AHP have been incorporated in various frameworks to conduct process evaluations[6], with Delphi applied to find the subjectively hierarchical relationships of AHP[7]. In 2009, Delphi and AHP were used in an exploratory study to rank critical success factors contributing to effective quality engineering tools and techniques[8]. ...
... There are a number of studies related to the design and optimization of differentcabin or cockpit layoutsusing computational intelligence. In 2001, a genetic algorithm (GA) using human-computer interaction was used to solve the problem of constrained layout optimization[5]. In 2013, a GA was successfully applied to cockpit layout optimization in civil aviation[9]. The same year, a GA and an ant colony algorithm were used to optimize the cockpit layout of a manned submersible[1-2]. However, PSO is easier and more efficient than the evolutionary algorithms mentioned above. PSOis a population-based stochastic optimization technique that was developed by[10]. In 2007, PSO was used to solve the multiple-level warehouse layout design problem [11]. In 2011, Kulturel-Konak successfully used PSO to solve the engineering problem for the layout of unequal area facilitieswith a flexible bay structure,which is a very commonlayout in manufacturing and retail facilities[12]. In 2012, PSO was applied to optimize the layout of a vertical channel in a ship’s hull [7]. Thus, PSO is known to be effective in solving complex engineering layout problems. Although the PSO algorithm has been successfully applied to different industrial areas and different engineering problems, relatively few applications have considered the layout design of cabins or cockpits. The optimization of a cockpit layout considers how facilitiescan be arranged more appropriately within a limited space. The cockpit layout optimization problem can be divided into two-dimensional and three-dimensional layout optimization problems[13]. In 2003, PSO was first used to solve the two-dimensional layout optimization of round facilities in a satellite cabin[14]. The following year, PSO was applied to solve the two-dimensional layout optimization problem of cube-like facilities in a rotation module [15]. However, PSO has been rarely usedto solve three-dimensional cockpit layout optimizationproblems[16], especially the problem of car cockpit layouts. ...
“Critical Success Factors for Implementing Quality Engineering Tools and Techniques in Malaysia and Indonesia’s Automotive Industries: An Exploratory Study,”
1
2009
... Customized servicesare increasingly popular and are becoming the general trend of passenger car cockpit design in China. The conception of the passenger carsconsidered in this articleis based on the definition of GB/T3730.1-2001.As the science and technology incorporated in passenger cars increase, new functions need to be integrated into the cockpit based on customer demands.This may require the cockpitinterior to be reshaped, which refers to the safety ergonomic problems.At present, the layout of a passenger car cockpit mainly depends on the experience of experts and designers. After any modification, an evaluation method is used, but this cannot solve the problem of passenger vehicle designing and development quickly. The cockpit layout optimization problem has received increasing attention. However, only the safety ergonomic theory was applied in the cockpit layout optimization [1-5], thus neglecting drivers’ affective factors. Additionally, most research subjects are non-standard cockpits, such as those of aircraft and submersibles. There is no effective method for solving the problem of passenger car cockpit layout optimization. Thus, an optimization design platform for the customized passenger car cockpit layouts based on safety ergonomic principles is needed.Analytic hierarchy process(AHP) as an evaluation measure has been used in cockpits effectively. In addition, Delphiand AHP have been incorporated in various frameworks to conduct process evaluations[6], with Delphi applied to find the subjectively hierarchical relationships of AHP[7]. In 2009, Delphi and AHP were used in an exploratory study to rank critical success factors contributing to effective quality engineering tools and techniques[8]. ...
“The Layout Optimization Study for Civil Aircraft Cockpit Ergonomics Design,
1
2013
... There are a number of studies related to the design and optimization of differentcabin or cockpit layoutsusing computational intelligence. In 2001, a genetic algorithm (GA) using human-computer interaction was used to solve the problem of constrained layout optimization[5]. In 2013, a GA was successfully applied to cockpit layout optimization in civil aviation[9]. The same year, a GA and an ant colony algorithm were used to optimize the cockpit layout of a manned submersible[1-2]. However, PSO is easier and more efficient than the evolutionary algorithms mentioned above. PSOis a population-based stochastic optimization technique that was developed by[10]. In 2007, PSO was used to solve the multiple-level warehouse layout design problem [11]. In 2011, Kulturel-Konak successfully used PSO to solve the engineering problem for the layout of unequal area facilitieswith a flexible bay structure,which is a very commonlayout in manufacturing and retail facilities[12]. In 2012, PSO was applied to optimize the layout of a vertical channel in a ship’s hull [7]. Thus, PSO is known to be effective in solving complex engineering layout problems. Although the PSO algorithm has been successfully applied to different industrial areas and different engineering problems, relatively few applications have considered the layout design of cabins or cockpits. The optimization of a cockpit layout considers how facilitiescan be arranged more appropriately within a limited space. The cockpit layout optimization problem can be divided into two-dimensional and three-dimensional layout optimization problems[13]. In 2003, PSO was first used to solve the two-dimensional layout optimization of round facilities in a satellite cabin[14]. The following year, PSO was applied to solve the two-dimensional layout optimization problem of cube-like facilities in a rotation module [15]. However, PSO has been rarely usedto solve three-dimensional cockpit layout optimizationproblems[16], especially the problem of car cockpit layouts. ...
“Particle Swarm Optimization,”
1
2011
... There are a number of studies related to the design and optimization of differentcabin or cockpit layoutsusing computational intelligence. In 2001, a genetic algorithm (GA) using human-computer interaction was used to solve the problem of constrained layout optimization[5]. In 2013, a GA was successfully applied to cockpit layout optimization in civil aviation[9]. The same year, a GA and an ant colony algorithm were used to optimize the cockpit layout of a manned submersible[1-2]. However, PSO is easier and more efficient than the evolutionary algorithms mentioned above. PSOis a population-based stochastic optimization technique that was developed by[10]. In 2007, PSO was used to solve the multiple-level warehouse layout design problem [11]. In 2011, Kulturel-Konak successfully used PSO to solve the engineering problem for the layout of unequal area facilitieswith a flexible bay structure,which is a very commonlayout in manufacturing and retail facilities[12]. In 2012, PSO was applied to optimize the layout of a vertical channel in a ship’s hull [7]. Thus, PSO is known to be effective in solving complex engineering layout problems. Although the PSO algorithm has been successfully applied to different industrial areas and different engineering problems, relatively few applications have considered the layout design of cabins or cockpits. The optimization of a cockpit layout considers how facilitiescan be arranged more appropriately within a limited space. The cockpit layout optimization problem can be divided into two-dimensional and three-dimensional layout optimization problems[13]. In 2003, PSO was first used to solve the two-dimensional layout optimization of round facilities in a satellite cabin[14]. The following year, PSO was applied to solve the two-dimensional layout optimization problem of cube-like facilities in a rotation module [15]. However, PSO has been rarely usedto solve three-dimensional cockpit layout optimizationproblems[16], especially the problem of car cockpit layouts. ...
“A Particle Swarm Optimization Algorithm for the Multiple-Level Warehouse Layout Design Problem,”
1
2008
... There are a number of studies related to the design and optimization of differentcabin or cockpit layoutsusing computational intelligence. In 2001, a genetic algorithm (GA) using human-computer interaction was used to solve the problem of constrained layout optimization[5]. In 2013, a GA was successfully applied to cockpit layout optimization in civil aviation[9]. The same year, a GA and an ant colony algorithm were used to optimize the cockpit layout of a manned submersible[1-2]. However, PSO is easier and more efficient than the evolutionary algorithms mentioned above. PSOis a population-based stochastic optimization technique that was developed by[10]. In 2007, PSO was used to solve the multiple-level warehouse layout design problem [11]. In 2011, Kulturel-Konak successfully used PSO to solve the engineering problem for the layout of unequal area facilitieswith a flexible bay structure,which is a very commonlayout in manufacturing and retail facilities[12]. In 2012, PSO was applied to optimize the layout of a vertical channel in a ship’s hull [7]. Thus, PSO is known to be effective in solving complex engineering layout problems. Although the PSO algorithm has been successfully applied to different industrial areas and different engineering problems, relatively few applications have considered the layout design of cabins or cockpits. The optimization of a cockpit layout considers how facilitiescan be arranged more appropriately within a limited space. The cockpit layout optimization problem can be divided into two-dimensional and three-dimensional layout optimization problems[13]. In 2003, PSO was first used to solve the two-dimensional layout optimization of round facilities in a satellite cabin[14]. The following year, PSO was applied to solve the two-dimensional layout optimization problem of cube-like facilities in a rotation module [15]. However, PSO has been rarely usedto solve three-dimensional cockpit layout optimizationproblems[16], especially the problem of car cockpit layouts. ...
“A New Relaxed Flexible Bay Structure Representation and Particle Swarm Optimization for the Unequal Area Facility Layout Problem,”
1
2011
... There are a number of studies related to the design and optimization of differentcabin or cockpit layoutsusing computational intelligence. In 2001, a genetic algorithm (GA) using human-computer interaction was used to solve the problem of constrained layout optimization[5]. In 2013, a GA was successfully applied to cockpit layout optimization in civil aviation[9]. The same year, a GA and an ant colony algorithm were used to optimize the cockpit layout of a manned submersible[1-2]. However, PSO is easier and more efficient than the evolutionary algorithms mentioned above. PSOis a population-based stochastic optimization technique that was developed by[10]. In 2007, PSO was used to solve the multiple-level warehouse layout design problem [11]. In 2011, Kulturel-Konak successfully used PSO to solve the engineering problem for the layout of unequal area facilitieswith a flexible bay structure,which is a very commonlayout in manufacturing and retail facilities[12]. In 2012, PSO was applied to optimize the layout of a vertical channel in a ship’s hull [7]. Thus, PSO is known to be effective in solving complex engineering layout problems. Although the PSO algorithm has been successfully applied to different industrial areas and different engineering problems, relatively few applications have considered the layout design of cabins or cockpits. The optimization of a cockpit layout considers how facilitiescan be arranged more appropriately within a limited space. The cockpit layout optimization problem can be divided into two-dimensional and three-dimensional layout optimization problems[13]. In 2003, PSO was first used to solve the two-dimensional layout optimization of round facilities in a satellite cabin[14]. The following year, PSO was applied to solve the two-dimensional layout optimization problem of cube-like facilities in a rotation module [15]. However, PSO has been rarely usedto solve three-dimensional cockpit layout optimizationproblems[16], especially the problem of car cockpit layouts. ...
“General Particle Swarm Optimization based on Simulated Annealing for Multi-Specification One-Dimensional Cutting Stock Problem,”
1
2006
... There are a number of studies related to the design and optimization of differentcabin or cockpit layoutsusing computational intelligence. In 2001, a genetic algorithm (GA) using human-computer interaction was used to solve the problem of constrained layout optimization[5]. In 2013, a GA was successfully applied to cockpit layout optimization in civil aviation[9]. The same year, a GA and an ant colony algorithm were used to optimize the cockpit layout of a manned submersible[1-2]. However, PSO is easier and more efficient than the evolutionary algorithms mentioned above. PSOis a population-based stochastic optimization technique that was developed by[10]. In 2007, PSO was used to solve the multiple-level warehouse layout design problem [11]. In 2011, Kulturel-Konak successfully used PSO to solve the engineering problem for the layout of unequal area facilitieswith a flexible bay structure,which is a very commonlayout in manufacturing and retail facilities[12]. In 2012, PSO was applied to optimize the layout of a vertical channel in a ship’s hull [7]. Thus, PSO is known to be effective in solving complex engineering layout problems. Although the PSO algorithm has been successfully applied to different industrial areas and different engineering problems, relatively few applications have considered the layout design of cabins or cockpits. The optimization of a cockpit layout considers how facilitiescan be arranged more appropriately within a limited space. The cockpit layout optimization problem can be divided into two-dimensional and three-dimensional layout optimization problems[13]. In 2003, PSO was first used to solve the two-dimensional layout optimization of round facilities in a satellite cabin[14]. The following year, PSO was applied to solve the two-dimensional layout optimization problem of cube-like facilities in a rotation module [15]. However, PSO has been rarely usedto solve three-dimensional cockpit layout optimizationproblems[16], especially the problem of car cockpit layouts. ...
“Particle Swarm Optimization and its Application of Constrained Layout Optimization,”
1
2004
... There are a number of studies related to the design and optimization of differentcabin or cockpit layoutsusing computational intelligence. In 2001, a genetic algorithm (GA) using human-computer interaction was used to solve the problem of constrained layout optimization[5]. In 2013, a GA was successfully applied to cockpit layout optimization in civil aviation[9]. The same year, a GA and an ant colony algorithm were used to optimize the cockpit layout of a manned submersible[1-2]. However, PSO is easier and more efficient than the evolutionary algorithms mentioned above. PSOis a population-based stochastic optimization technique that was developed by[10]. In 2007, PSO was used to solve the multiple-level warehouse layout design problem [11]. In 2011, Kulturel-Konak successfully used PSO to solve the engineering problem for the layout of unequal area facilitieswith a flexible bay structure,which is a very commonlayout in manufacturing and retail facilities[12]. In 2012, PSO was applied to optimize the layout of a vertical channel in a ship’s hull [7]. Thus, PSO is known to be effective in solving complex engineering layout problems. Although the PSO algorithm has been successfully applied to different industrial areas and different engineering problems, relatively few applications have considered the layout design of cabins or cockpits. The optimization of a cockpit layout considers how facilitiescan be arranged more appropriately within a limited space. The cockpit layout optimization problem can be divided into two-dimensional and three-dimensional layout optimization problems[13]. In 2003, PSO was first used to solve the two-dimensional layout optimization of round facilities in a satellite cabin[14]. The following year, PSO was applied to solve the two-dimensional layout optimization problem of cube-like facilities in a rotation module [15]. However, PSO has been rarely usedto solve three-dimensional cockpit layout optimizationproblems[16], especially the problem of car cockpit layouts. ...
“Layout Optimization of Cube Group in Rotation Module,”
1
2004
... There are a number of studies related to the design and optimization of differentcabin or cockpit layoutsusing computational intelligence. In 2001, a genetic algorithm (GA) using human-computer interaction was used to solve the problem of constrained layout optimization[5]. In 2013, a GA was successfully applied to cockpit layout optimization in civil aviation[9]. The same year, a GA and an ant colony algorithm were used to optimize the cockpit layout of a manned submersible[1-2]. However, PSO is easier and more efficient than the evolutionary algorithms mentioned above. PSOis a population-based stochastic optimization technique that was developed by[10]. In 2007, PSO was used to solve the multiple-level warehouse layout design problem [11]. In 2011, Kulturel-Konak successfully used PSO to solve the engineering problem for the layout of unequal area facilitieswith a flexible bay structure,which is a very commonlayout in manufacturing and retail facilities[12]. In 2012, PSO was applied to optimize the layout of a vertical channel in a ship’s hull [7]. Thus, PSO is known to be effective in solving complex engineering layout problems. Although the PSO algorithm has been successfully applied to different industrial areas and different engineering problems, relatively few applications have considered the layout design of cabins or cockpits. The optimization of a cockpit layout considers how facilitiescan be arranged more appropriately within a limited space. The cockpit layout optimization problem can be divided into two-dimensional and three-dimensional layout optimization problems[13]. In 2003, PSO was first used to solve the two-dimensional layout optimization of round facilities in a satellite cabin[14]. The following year, PSO was applied to solve the two-dimensional layout optimization problem of cube-like facilities in a rotation module [15]. However, PSO has been rarely usedto solve three-dimensional cockpit layout optimizationproblems[16], especially the problem of car cockpit layouts. ...
“An Anthropometric Analysis of Korean Male Helicopter Pilots for Helicopter Cockpit Design,”
1
2013
... There are a number of studies related to the design and optimization of differentcabin or cockpit layoutsusing computational intelligence. In 2001, a genetic algorithm (GA) using human-computer interaction was used to solve the problem of constrained layout optimization[5]. In 2013, a GA was successfully applied to cockpit layout optimization in civil aviation[9]. The same year, a GA and an ant colony algorithm were used to optimize the cockpit layout of a manned submersible[1-2]. However, PSO is easier and more efficient than the evolutionary algorithms mentioned above. PSOis a population-based stochastic optimization technique that was developed by[10]. In 2007, PSO was used to solve the multiple-level warehouse layout design problem [11]. In 2011, Kulturel-Konak successfully used PSO to solve the engineering problem for the layout of unequal area facilitieswith a flexible bay structure,which is a very commonlayout in manufacturing and retail facilities[12]. In 2012, PSO was applied to optimize the layout of a vertical channel in a ship’s hull [7]. Thus, PSO is known to be effective in solving complex engineering layout problems. Although the PSO algorithm has been successfully applied to different industrial areas and different engineering problems, relatively few applications have considered the layout design of cabins or cockpits. The optimization of a cockpit layout considers how facilitiescan be arranged more appropriately within a limited space. The cockpit layout optimization problem can be divided into two-dimensional and three-dimensional layout optimization problems[13]. In 2003, PSO was first used to solve the two-dimensional layout optimization of round facilities in a satellite cabin[14]. The following year, PSO was applied to solve the two-dimensional layout optimization problem of cube-like facilities in a rotation module [15]. However, PSO has been rarely usedto solve three-dimensional cockpit layout optimizationproblems[16], especially the problem of car cockpit layouts. ...
“Measuring the Functional and Usable Appeal of Crossover B‐Car Interiors,”
2
2015
... Becausethe data analysis is related to the diversity, as suggested by [17], the consensus among the rankings was measured using Kendall’s W. ...
... The semantic differential (SD) method can be usedto extract user-centered emotional opinions[21].To measure user attitudesto the degree of crowdedness in car cockpits[17], the semantic differential scaleshown in Figure2was used to record the opinions of users. The relationship between the crowdedness in the car and the recorded figures can then beanalyzed using least-squaresmultiple regression. ...
“Development of a New Technology Product Evaluation Model for Assessing Commercialization Opportunities using Delphi Method and Fuzzy AHP Approach,”
1
2013
... After normalizingw, therelative importance of thecriteria at the lowest criterion levelis given by[18]: ...
“Efficient Algorithm for Prolonging Network Lifetime of Wireless Sensor Networks,”
1
2011
... In PSO, each single solution is a particle in the search space. All particles have fitness values that are evaluated by a fitness function and velocities that determine their direction within the search space. The particles move through the problem space by following the current optimum particles[19].PSO is modified by the inertia-adaptive factorto improve the global search ability and prevent becoming trapped around local optima. The inertia-adaptivefactor is given by: ...
“Ergonomics Layout Optimization of the Aircraft Cockpit based on Particle Swarm Optimization,”
1
2014
... Where $\alpha $represents theangle of view from facility i to facility j.$({{x}_{i}},{{y}_{i}},{{z}_{i}})$are the areal coordinates of facility i,and $({{x}_{k}},{{y}_{k}},{{z}_{k}})$are the areal coordinates of facilityk.The maximum horizontal view angle of the human eye is 156°, and the maximum horizontal view angle of both eyes together is 188°.In this case, the angle of the overlapping space is 124°, and the comfortable view angle of one eye is 60°[20]. ...
“Optimization Design of a Webpage based on Kansei Engineering,”
1
2016
... The semantic differential (SD) method can be usedto extract user-centered emotional opinions[21].To measure user attitudesto the degree of crowdedness in car cockpits[17], the semantic differential scaleshown in Figure2was used to record the opinions of users. The relationship between the crowdedness in the car and the recorded figures can then beanalyzed using least-squaresmultiple regression. ...


