


1. Introduction
The bale stacker is mainly used for the collection, palletizing, and transportation of bales in the pasture production. The palletizing mechanism is a key structure of the bales stacker [1]. The function of the stacker is directly related to the palletizing quality and efficiency of the bales. In order to realize the vertical and horizontal arrangement of bales, a reasonable baling palletizing mechanism and its control system should be designed. The design of a reasonable hydraulic system is critical to make the palletizing mechanism complete palletizing quickly and accurately by using hydraulics as the power of the control system [2]. In this paper, the optimization model of hydraulic system is established by using AMESim software. By adjusting the parameters of several important factors, the dynamic characteristics of the hydraulic system are studied, and the liquid control system is optimized.
When the hydraulic system fails, it is usually difficult to directly observe, and the various causal relationships are complex. These effects make the fault location not only difficult to find, but also overlapping and intersecting between the faults and the causes. In addition, the service life of hydraulic components, hydraulic system operating environment, and other interference factors pose some challenges to troubleshoot the hydraulic system [3]. Failure Mode Effects and Criticality Analysis (FMECA) is a widely-used reliability analysis method. In terms of reliability analysis, the failure effects are critical. Researchers often describe the failure modes in fuzzy languages, such as the probability of occurrence, the detection, and the severity of the impact. The individual differences make qualitative descriptions subjective and inaccurate [4]. Many researchers have conducted in-depth studies in response to these problems.
Kellerc et al. [5] used fuzzy logic rules for reliability studies. Guimarães et al. [6] applied fuzzy inference systems to FMEA, which is of great significance for product reliability analysis. Bowles et al. [7] introduced fuzzy mathematics theory and proposed an evaluation method based on fuzzy mathematics. Dai et al. [8] used the fuzzy comprehensive evaluation method to improve FMECA and solved its deficiencies in the reliability analysis of electro-hydraulic servo valves. Chen et al. [9] introduced fuzzy set theory into the reliability evaluation of industrial hydraulic systems, which reduced the failure rate of traditional fault prediction methods. Li et al. [10] applied a multi-level fuzzy comprehensive evaluation method to analyze civil aircraft electro-hydraulic servos. Hu et al. [11] combined fuzzy theory with traditional FMECA to analyze the influence and severity of failure modes of the hydraulic system of the amphibious armored vehicle. In this paper, the fuzzy theory is applied to FMECA methods, and the quantitative method is used to deal with the qualitative problem of describing the hazards of the failure modes. By adjusting the parameters of several more important influencing factors, the hydraulic control system is optimized.
2. Square Bale Pusher Design
In the harvesting machinery of square bale picking and stacking pallets, forage harvesting machinery mainly based on bales is commonly used in the Chinese market. However, its drawbacks are very obvious; for example, there is a single palletizing method, the process is cumbersome, and the palletizing efficiency is low. In order to overcome the drawbacks of domestic palletizing machinery as well as achieve better stacking efficiency of pallets, we designed a bale pusher as shown in Figure 1.
Figure 1.
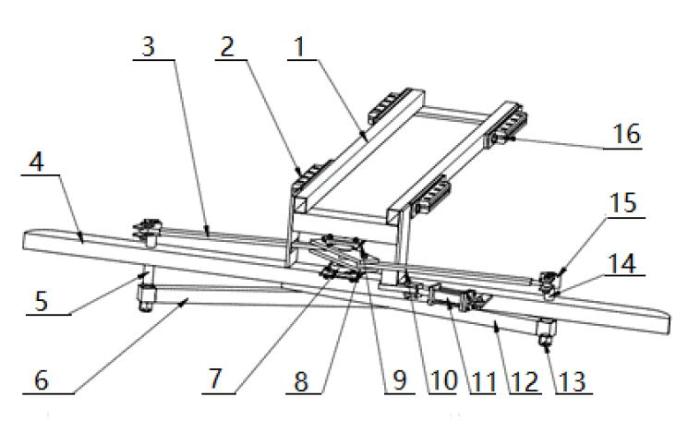
Figure 1.
Bale tie arm device
1. Square steel frame; 2. Slide rail block; 3. Lower swing arm; 4. Transverse thrust bar; 5. Drive shaft; 6. Lower shift bar; 7. Seat bearing; 8. Movable splint; 9. Drive shaft; 10. Upper arm rod; 11. Hydraulic cylinder; 12. Upshift rod; 13. Hexagonal nut; 14. Spacer; 15. Bolt; 16. Slide block seat
3. Establishment of Hydraulic System Model of Tie Arm Device
3.1. Establishment of Hydraulic Model for Tie Arm Device
To achieve the tie arm device in different positions of the lock, a two-way hydraulic lock is utilized. The bi-directional hydraulic lock shares a valve body and a control spool, the pilot-operated check valve is located on both sides, and the control spool is located in the middle. As shown in Figure 2, the two-way hydraulic lock works in the following manner: when the pressure oil from the A cavity goes to the left of the one-way valve into the A1 cavity and then through the control valve and right one-way valve, the original package and B1 cavity of the hydraulic oil are discharged through the B cavity. When the A and B cavities have no pressure oil, the conical valve conical valve and valve body close contact make the A1 and B1 cavities seal, and the implementing element is the bi-directional lock [12].
Figure 2.
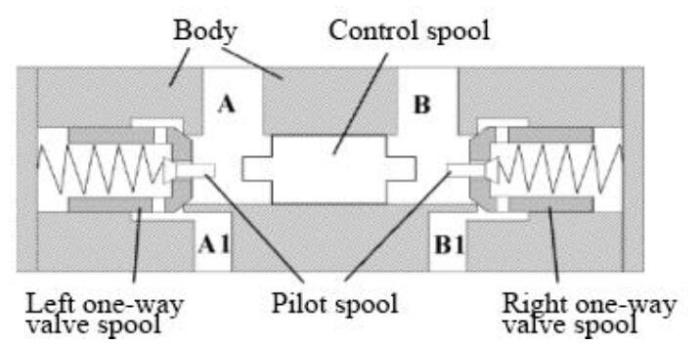
Figure 2.
Bi-directional hydraulic lock schematic diagram
In this system, we use position feedback to control the tie arm device in different positions of the lock. The position sensor is used to change the position signal of the hydraulic cylinder. The position cycle is set by the position cycle sub-model. The working principle of the system is as follows: the specified position is compared with the feedback position of the sensor to generate the error value, and the error multiplied by the gain signal drives the servo valve to turn on or off the hydraulic oil supply of the actuator and change the oil feeding direction. The system can automatically adjust until the error is zero [13]. The system model is shown in Figure 3.
Figure 3.
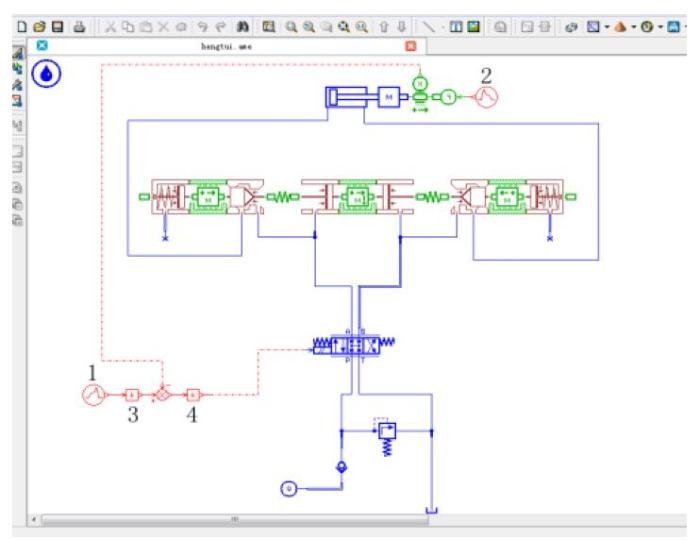
Figure 3.
Tie arm device hydraulic system mode l
3.2. Basic Parameters Set
The hydraulic system part of the important parameters set is shown in Table 1.
Table 1. Tie arm device subsystem parameters
| Parameters | Unit | Value |
|---|---|---|
| Fuel flow | L/min | 35 |
| Safety valve opening pressure | MPa | 10 |
| Hydraulic oil temperature | Degc | 40 |
| Hydraulic oil density | kg/m3 | 850 |
| Directional valve to open the current | Ma | 200 |
| Directional valve natural frequency | Hz | 50 |
| Gain signal 1 value | 10 | |
| Gain signal 2 value | 250 | |
| Control valve core displacement limit | M | ±0.0045 |
| Control spool damping | N/m/s | 1000 |
| Conical valve taper | Degree | 60 |
| One-way valve core quality | kg | 0.068 |
| Check valve limit displacement | M | ±0.00628 |
| One-way valve core spring stiffness | N/mm | 130 |
| Horizontal push cylinder piston rod diameter | mm | 56 |
| Horizontal push hydraulic cylinder diameter | mm | 80 |
| Displacement sensor output signal gain | 1/m | 10 |
3.3. System Model Verification
In this paper, the simulation time is 12 seconds, the simulation step is 0.01 seconds, and the simulation results are shown in Figure 4.
Figure 4.
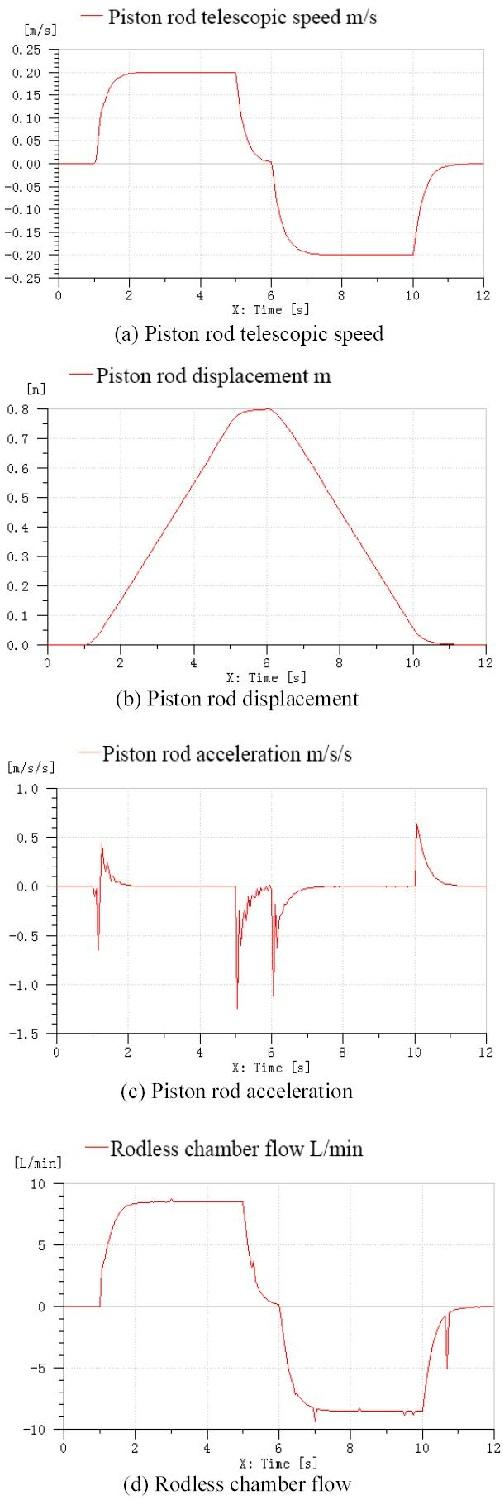
Figure 4.
Tie arm device subsystem simulation
As can be seen from Figure 4(a), the piston rod accelerates from 0.2m/s in 1 ~ 2 seconds, stays steady at 2 ~ 5 seconds, decelerates to 0m/s in 5 ~ 6 seconds, and then the speed change of the piston rod retracts in 6 ~ 12 seconds. The aforementioned process is similar to that of the extension; From Figure 4(b), the piston rod extending 0.8m meets the actual situation. From Figure 4(c), the acceleration fluctuations greatly in the 1st, 5th, 6th, and 10th seconds. The piston rods either start from 0m/s or slow down at a steady speed, so the image is also conformity. From Figure 4(d), the inlet flow curve of the rodless cavity can match Figure 4(a) closely, so the hydraulic subsystem model is generally correct.
4. Hengshui Device Hydraulic System Optimization
4.1. Control Parameter Optimization
In AMESim, the dynamic characteristics of the three bit four way hydraulic servo valve spool are represented by a two order oscillatory system. Based on the automatic control principle, in the closed loop control system composed of the two order systems, the amplification factor of the preamplifier of the two order system has a great impact on the dynamic performance of the system. In this hydraulic subsystem, the preamplifier is represented by the gain 4, and the value of the gain 4 is adjusted repeatedly. The displacements of actual output and the piston rod of the hydraulic cylinder are observed. Given the difference between the expected value and the actual value, it can be obtained that the smaller the difference, the better the performance. The optimal parameter [14], which makes the system performance the best state, is found. Here, a traditional method is used to set the value of gain 4 to 200, 300, 400, 500, 600, and 700. The simulation length is set to 12 seconds, the simulation step is 0.05, and the batch mode is entered.
The desired displacement is calculated with the result of the piston rod displacement obtained from the simulation. The results are shown in Figure 5.
Figure 5.
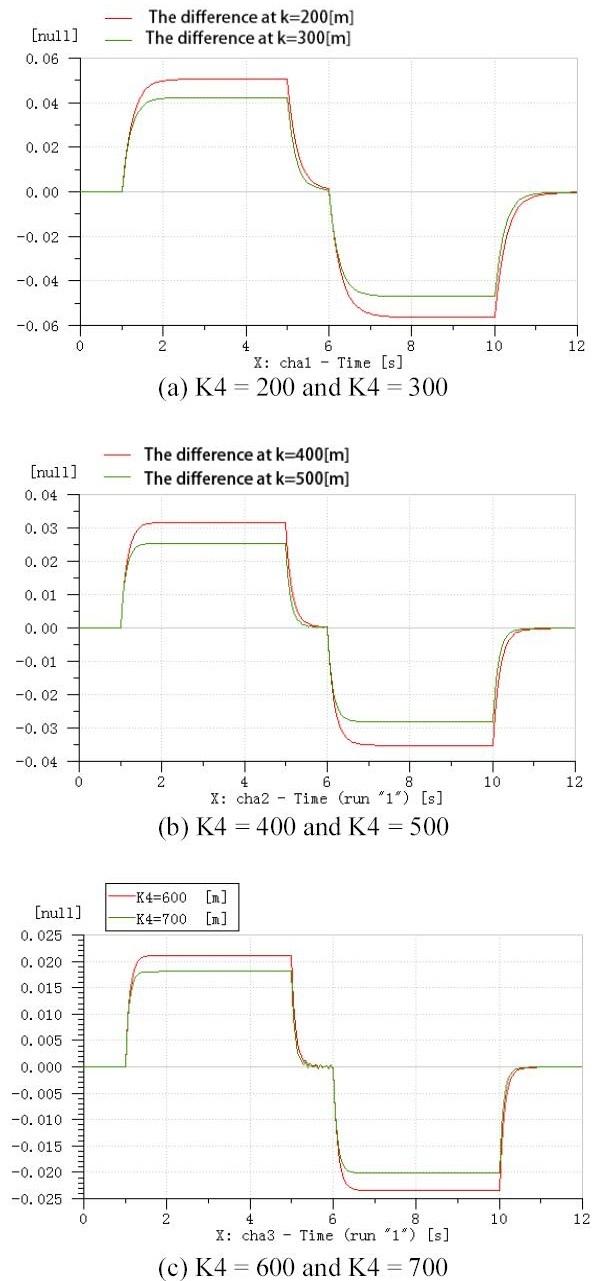
Figure 5.
The difference between piston rod displacement and expected value under different K4 values
It can be observed from Figure 5(a) that when the K4 value is equal to 200, the dynamic error of the system is close to 0.06m, and it takes about 1s for the system to reach a stable state. When the K4 value is equal to 700, the dynamic error of the system is close to 0.02m, and the system only takes about 0.3s to reach the steady state. Based on Figures 5(a), 5(b), and 5(c), it can be concluded that when K4 takes a greater value, the response of the system is faster and the dynamic error of the system is smaller.
As K4 takes a bigger value, however, it will cause overshoot of the following curve. The system will obviously oscillate and affect its own stability. We combine the curves under these different values and then perform local amplification, and the obvious difference is shown in Figure 6.
Figure 6.
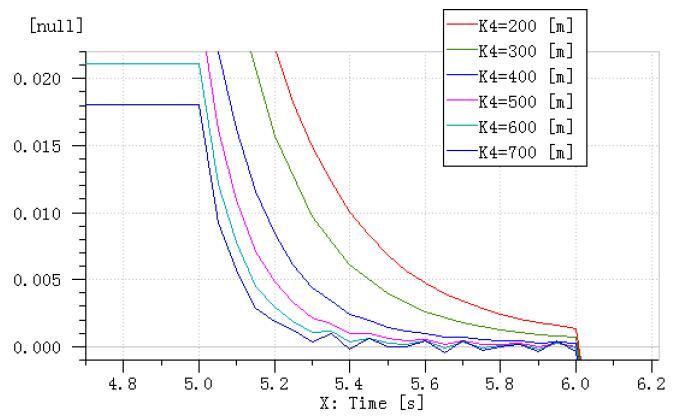
Figure 6.
Local magnification of piston rod displacement and expected value difference under different K4 values
From Figure 6, we can see that when the K4 value is 500, the system starts to oscillate within 5 ~ 6 seconds. When the K4 takes the value of 700, the oscillation of the system within 5 ~ 6 seconds is very obvious. With respect to both system error and stability, the value of gain 4 is repeated, and the optimum value range of K4 is 440 ~ 480.
4.2. Optimization of Structural Parameters
Several key structural parameters of the bi-directional hydraulic lock (i.e., control valve core mass, one-way valve core mass, control valve core damping, and one-way valve core stiffness) are set and simulated. Compared with the control valve core and one-way valve core of the system, the control valve damping value and the size of the one-way valve stiffness of the entire system has a greater impact. Accordingly, the aforementioned two parameters are studied [15].
4.2.1 Control Spool Damping Optimization
By changing the damping value of the control valve core, the curve of piston rod extension time under different damping values can be simulated. The results are shown in Figure 7. The average pressure curve and flow curve of the hydraulic cylinder under different damping of the control valve core are shown in Figures 8 and 9, respectively.
Figure 7.
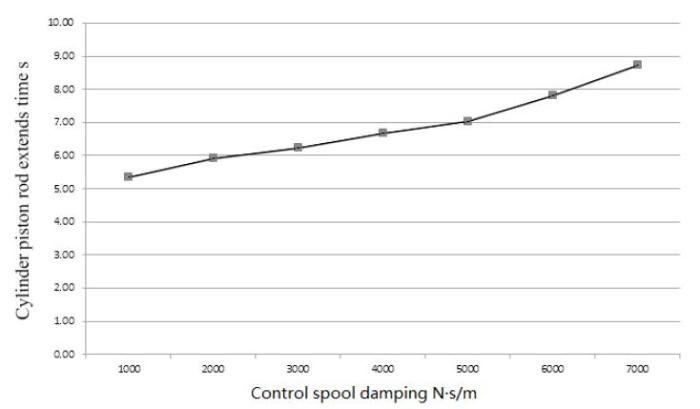
Figure 7.
Different control spool damping hydraulic cylinder piston rod out of time
Figure 8.
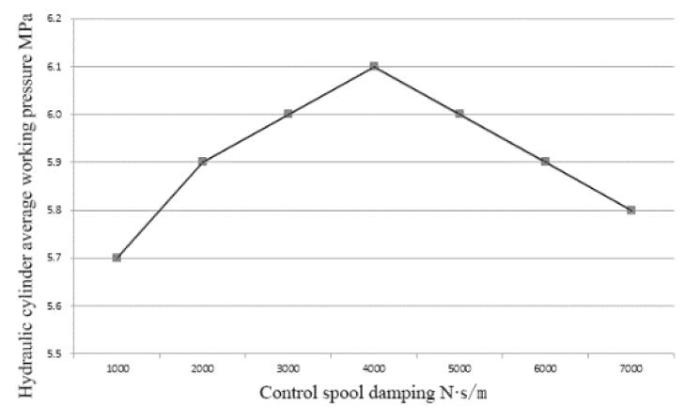
Figure 8.
Different valve cylinder damping under the average working pressure cylinder
Figure 9.
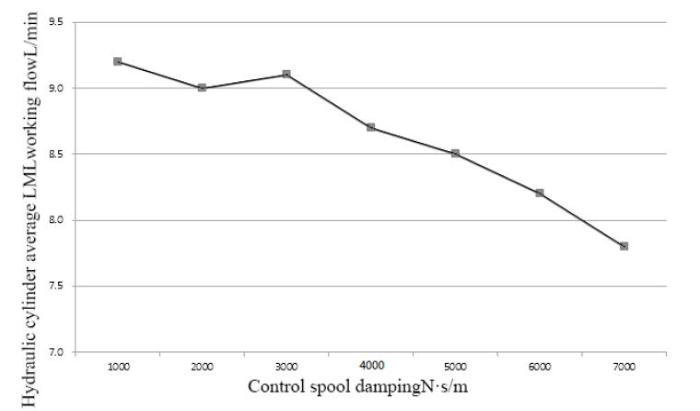
Figure 9.
Different control spool damping cylinder average working flow
As can be seen from Figure 7, as the control spool damping increases, the hydraulic cylinder piston rod extension time becomes significantly larger and grows linearly, increasing from the initial 5.35 seconds to 8.72 seconds.
It can be seen from Figures 8 and 9 that the damping of the control valve core is between 1000 and 7000N
After comprehensive analysis based on Figures 7-9, it can be obtained that when the control valve spool damping values stay within the range of 3000 ~ 4000N·s/m, this can not only guarantee the piston rod out timely, but also maintain the stability of pressure as well as speed.
4.2.2. One-Way Valve Core Spring Stiffness Optimization
By changing the stiffness of the unidirectional valve core, the curve of the piston cylinder rod extension time under different unidirectional valve core stiffness can be simulated, as shown in Figure 10. The average pressure curve and average flow curve of the cylinder under different unidirectional valve core stiffness are shown in Figures 11 and 12, respectively.
Figure 10.
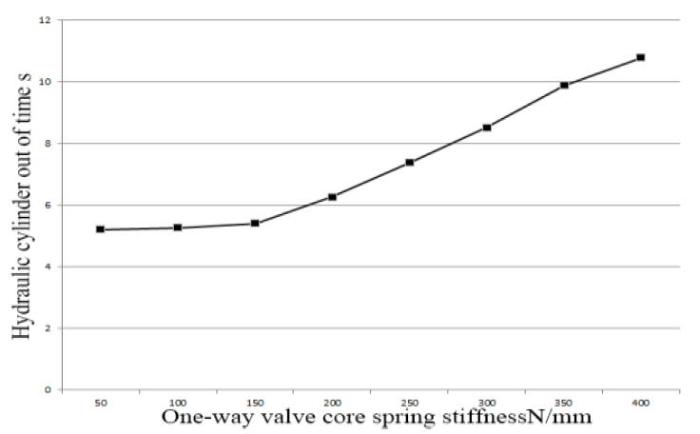
Figure 10.
Piston rod extension time with different spring stiffness of check valve
From Figure 10, we can see that when the stiffness of the one-way valve core is below 150N/mm, the extension time of the piston rod of the hydraulic cylinder basically remains at 5.3 seconds. When the stiffness is greater than 150N/mm, the piston rod extension time is obviously longer. In addition, when the stiffness value is 400N/mm, the piston extension time reaches 10.79 seconds. This indicates that the stiffness of the one-way valve spring has a great influence on the performance of the hydraulic cylinder.
It can be seen from Figure 11 that the mean working pressure increases when the spring rate is less than 150N/mm. When the spring rate is greater than 150N/mm, the average working pressure also increases. As can be seen from Figure 12, the flow rate of the hydraulic cylinder changes drastically with an increase in spring stiffness. Spring stiffness is in the range of 50 ~ 400N/mm, and the cylinder flow quickly drops from 10.1L/min to 6.9L/min. However, the cylinder flow changes more smoothly, which indicates that the piston rod protruding speed is relatively stable [16].
Figure 11.
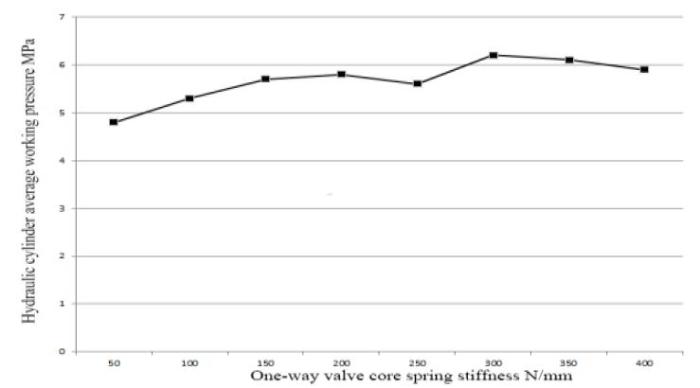
Figure 11.
Average working pressure of hydraulic cylinder under different unidirectional valve core spring stiffness
Figure 12.
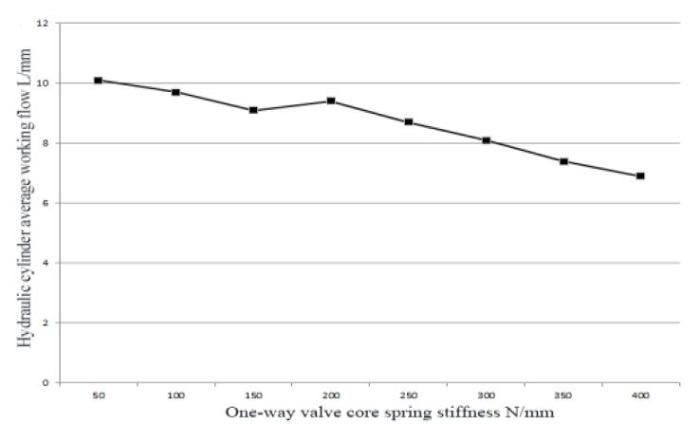
Figure 12.
Average working flow of hydraulic cylinder under different unidirectional valve core spring stiffness
When the value of the check valve spring stiffness is in the range of 50 ~ 400N/mm, select the range of one-way valve core stiffness as 100 ~ 150N/mm. This can ensure that the piston rod extends in time, and it can also better ensure the pressure stability and speed stability.
5. Fuzzy FMECA Method
The fuzzy FMECA method combines the fuzzy comprehensive evaluation method and the FMECA method. The danger of the failure can be clearly manifested to make the traditional FMECA method more scientific [17].
The basic steps of the fuzzy FMECA method are as follows:
(1) Define a set of factors
The set of factors affect the object of evaluation, and different elements represent different influencing factors. Factor sets are usually represented by U, that is,
Where
(2) Set up the evaluation set
The evaluation set is usually indicated by V:
Where
(3) Establish the fuzzy factor evaluation matrix
A fuzzy mapping f for U to V is given,
This article uses statistical methods to determine membership, an expert evaluation team composed of h persons is established, each member evaluates one and only one evaluation grade
The n failure modes of each factor evaluation set written by the fuzzy factor level evaluation matrix R are:
(4) Determine the weight of each factor set
Because each factor has a different influence on the failure, it is necessary to give the importance of each factor in the total evaluation during the process of comprehensive evaluation. The steps of using the analytic hierarchy process are described as follows:
According to the judgment matrix A, it calculates its maximum eigenvalue
Where
Table 3.
| n | n | ||
|---|---|---|---|
| 1 | 0.00 | 8 | 1.41 |
| 2 | 0.00 | 9 | 1.45 |
| 3 | 0.58 | 10 | 1.49 |
| 4 | 0.90 | 11 | 1.52 |
| 5 | 1.12 | 12 | 1.54 |
| 6 | 1.24 | 13 | 1.56 |
| 7 | 1.32 |
When
(5) A fuzzy comprehensive evaluation
Rewrite the set of failure mode factor weights as a vector mode.
Where
(6) Determine the level of comprehensive hazard
In order to interpret the result more intuitively, B is processed by the weighted average method to obtain a simple numerical value C to represent the evaluation result, that is:
(7) Multi-level fuzzy comprehensive evaluationThe actual complex system consists of multiple subsystems. When we use multi-level fuzzy comprehensive evaluation, the first level fuzzy comprehensive evaluation of each sub-system failure mode is carried out, and the fuzzy comprehensive evaluation vector and comprehensive hazard level score are obtained. Then, system failure modes as a second-level fuzzy comprehensive evaluation of the factors are expressed asU = {fault mode 1, fault mode 2,
6. The Cross-Pushing Device Hydraulic System Fuzzy FMECA Analysis
The design of the hydraulic control system is analyzed, combined with relevant information, servo valves, hydraulic cylinders, check valves, reversing valves, and piping in a liquid-controlled system. As an example, the fuzzy FMECA method is used to compute its reliability [20]. The FMECA tables of the five components are shown in Table 4.
Table 4. Hydraulic control system five parts FMECA table
| Product name | Sequence Number | Failure mode | Cause of issue | Local effects | High level impact | The final impact | Severity level | Take measures |
|---|---|---|---|---|---|---|---|---|
| Servo | 1 | Slow response, slow response | Reduced oil pressure | Cylinder instability | Corresponding push, dial action instability | Tie arm device stacking quality decline | Ⅲ level | Increase the pressure of oil supply |
| 2 | Vibration appears | The system gain is too high | Cylinder instability | Corresponding push, dial action instability | Tie arm device stacking quality decline | Ⅱ level | Reduce system gain | |
| Hydraulic Cylinder | 3 | Leakage | Seal failure | Cylinder lack of thrust | Corresponding to push, dial performance decline | Tie arm device stacking quality decline | Ⅲ level | Replace the seal |
| 4 | Internal leakage | Seals wear | Cylinder instability | Corresponding to push, dial performance decline | Tie arm device stacking quality decline | Ⅲ level | Replace the seal | |
| 5 | Crawl | Hydraulic cylinder accumulates air | Cylinder instability | Hydraulic cylinder life is reduced | Tie arm device stacking quality decline | Ⅲ level | Exhaust the air | |
| 6 | Lack of thrust | Frictional resistance is too large | Reduced effective traction cylinder | Corresponding push, dial action instability | Tie arm device stacking quality decline | Ⅲ level | Adjust the cylinder and piston with the gap | |
| Check valve | 7 | Oil is not countercurrent | Check valve stuck | Valve does not work | Corresponding push, dial no corresponding action | Tie arm device to stop working | Ⅱ level | Demolition, cleaning valve |
| Directional valve | 8 | Commutation is not reliable | Spring deformation fracture | Cylinder instability | Corresponding push, dial action instability | Tie arm device stacking quality decline | Ⅱ level | Adjust the gap |
| 9 | Commutation moves slowly | Poor lubrication | Change the valve function | Corresponding push, dial action instability | Tie arm device stacking quality decline | Ⅲ level | Adjust the viscosity of the lubricant | |
| Pipeline | 10 | Pipeline blocked | Oil pollution | Inadequate supply of oil | Cylinder instability | Tie arm device stacking quality decline | Ⅳ level | Filter oil impurities |
The steps of the fuzzy FMECA analysis of hydraulic system are as follows:
(1) Set up a set of factors
For the failure of the hydraulic system for hazard assessment, the set of factors used are as follows:
U = {probability of failure, severity, ease of detection, ease of maintenance}
(2) Set up an evaluation set
The factors are divided into four levels: V = {1, 2, 3, 4}. The different factors for the level of division are shown in Table 5.
Table 5. Factor ranking table
| Influencing factors | Grade | |||
|---|---|---|---|---|
| 1 | 2 | 3 | 4 | |
| Failure probability level ( | rarely happens | occasionally | occasionally happens | happens very often |
| Severity level ( | slight influence | medium effect | tremendous influence | deadly impact |
| Detection level of difficulty ( | accurate detection | not easy to detect | hard to detect | unable to detect |
| Maintenance level of difficulty ( | simple debugging | re-install | replace parts | unable to repair |
(3) Establish fuzzy evaluation matrix of failure mode
Ten experts proficient in the hydraulic system send the questionnaire. We have
Similarly, we can get the fuzzy factor evaluation matrix of the remaining nine failure modes as
(4) Determine the weight set
Firstly, the factor weight set of failure mode 1 is solved. According to Tables 2 and 4, the relative importance of the four influencing factors of failure mode 1 are determined. The data are shown in Table 6.
Table 6. Failure mode 1 the relative importance and weight of each influencing factor
| Influencing factors | ||||
|---|---|---|---|---|
| 1 | 3 | 7 | 5 | |
| 1/3 | 1 | 5 | 3 | |
| 1/7 | 1/5 | 1 | 1/3 | |
| 1/5 | 1/3 | 3 | 1 |
Table 6 can be obtained by the failure mode 1 judgment matrix
From the MATLAB software, the maximum eigenvalue of the 4
Consistency test:
Since the judgment matrix
Since
Thus, the factor weight set for failure mode 1 is
The same weight set is used for the influence factors of each failure mode:
(5) A fuzzy comprehensive evaluation
The first-level fuzzy comprehensive evaluation of failure mode 1 can be obtained by Equation (7):
Empathy:
(6) A comprehensive level of hazard
From Equation (8), the comprehensive hazard level of fault mode 1 is
According to the level of the integrated hazard level, the fault modes 1 to 10 may be ranked according to their degree of danger as follows [5]: fault mode 10 > fault mode 9 > fault mode 7 > fault mode 8 > fault mode 4 > fault mode 2 > fault mode 5 > fault mode 3 > fault mode 1 > fault mode 6.
(7) Two-level fuzzy comprehensive evaluation
For the servo valve, the set of factors
According to the size of the integrated hazard, it can be seen that the arrangement of the five components with higher hydraulic system failure rate is: Piping > Check valve > Directional valve > Servo valve > Hydraulic cylinder. The most dangerous failure mode in the pipeline is the pipeline blockage. The servo valve in the most dangerous mode of failure is the emergence of vibration that is followed by the slow reaction. For the hydraulic cylinder, the failure mode of danger from large to small arrangement is: internal leakage, crawling, leakage, and lack of thrust.
The same method can be used to calculate the breakdown of the other components of the hydraulic system.
7. Conclusions
(1) Through the working principle of the bale pusher device, the model and parameters of the hydraulic system are built and simulated in the AMESim software. The simulation results show that the model is consistent with the actual situation.
(2) The combination of fuzzy theory and FMECA method overcomes the shortcomings of FMECA, quantifies the ambiguity index, and comprehensively evaluates these indicators using the quantitative calculation method, which can provide evaluation results that are more suitable for practical applications and reference for the further improvement of the reliability of the hydraulic system of the horizontal push device.
(3) By changing the control parameters and structural parameters, the structural parameters of the system are successfully optimized. The simulation results show that the optimal range of the preamplifier K4 is 440-480, the damping coefficient of the control valve core is 3000 ~ 4000N
Reference
“Grassland Engineering Mechanics,”
“Hydraulic Transmission and Pneumatic Transmission,”
“Research Progress of Hydraulic System Reliability,”
“Tractor Use Reliability Fuzzy Comprehensive Evaluation,”
“Further Applications of Fuzzy Logic to Reliability Assessment and Safety Analysis,”
“Effects Analysis Fuzzy Inference System in Nuclear Problems using Approximate Reasoning,”
“Fuzzy Logic Prioritization of Failures in a System Failure Mode, Effects and Criticality Analysis,”
“Fuzzy Comprehensive Evaluation in FMECA of Electro-Hydraulic Servo Valve”
,
“Reliability Prediction Method of Hydraulic System by Fuzzy Theory”
,
DOI:10.3182/20130410-3-CN-2034.00009
URL
[Cited within: 1]

The hydraulic system's reliability is a key factor to ensure the reliable operation of equipment and it is very important to evaluate reliability of hydraulic system. The paper describes a reliability prediction method that may be used to evaluate the reliability of hydraulic systems for industrial applications. The proposed method takes advantage of fuzzy set theory. The aim of this method is to minimize the deficiencies of the traditional reliability prediction methods treating a failure rate as fixed value due to insufficiency practice data. Triangular fuzzy number and Gaussian fuzzy number are used in the application of this prediction method, where environmental factor, derating factor, and other factors are considered. Finally, an example of type crane's hydraulic system is given to verify the feasibility and practicability of the method.
“Reliability Analysis of Electrohydraulic Servo Actuator based on Fuzzy FMECA”
,
“Fuzzy Reliability Analysis in FMECA of Amphibious Armored Vehicle Hydraulic System,”
“Application of AMESim Simulation Technology in Design Analysis of Hydraulic System,”
“Design and Simulation of Hydraulic Transmission of Potato Harvester based on AMESim”
,
“Design and Optimization of a Novel Electrically Controlled High Pressure Fuel Injection System for Heavy Fuel Aircraft Piston Engine,”
“Structural Optimization and Simulation of Marine Hydraulic Damper based on AMESim,”
“Application of Fuzzy FMECA in Analysis of Product Reliability”
,
DOI:10.1109/CCECE.2010.5575154
URL
[Cited within: 1]
During reliability analysis of products,many evaluation elements are involved and failure information and evaluation indexes are fuzzy,so it is difficult to give credible and accurate analysis results.In order to resolve this problem,the fuzzy comprehensive evaluation was introduced in failure mode effect and criticality analysis(FMECA).Factors set,evaluation set,Judgement matrix for fuzzy factors and weights set were established to quantify the qualitative evaluation index.Taking the sensor of electromagnetic flowmeter as an example,analysis table for failure modes and effects analysis(FMEA) was established and criticalities of failure modes in the table were evaluated.According to the criticality,failure modes were ranked and emphases of reliability improvement were found.The result shows that the conclusion is consistent with the fact,so this method is available for taking full advantage of fuzzy information of system to analyze the reliability of product.
“Fuzzy FMECA (Failure Mode Effect and Criticality Analysis) of LNG Storage Facility,”
“A Combined Multi-Criteria Approach to Support FMECA Analyses: A Real-World Case,”
“Fuzzy FMECA based on Common Faults of Wind Turbine Generator,”
“Design of Reliability Critical System using Axiomatic Design with FMECA,”
DOI:10.1016/j.ijnaoe.2017.11.004
URL
[Cited within: 1]
In product design, the initial design stage is being increasingly emphasized because it significantly influences the successive product development and production stages. However, for larger and more complex products, it is very difficult to accurately predict product reliability in the initial design stage. Various design methodologies have been proposed to resolve this issue, but maintaining reliability while exploring design alternatives is yet to be achieved. Therefore, this paper proposes a methodology for conceptual design considering reliability issues that may arise in the successive detailed design stages. The methodology integrates the independency of axiomatic design and the hierarchical structure of failure mode, effects, and criticality analysis (FMECA), which is a technique widely used to analyze product reliability. We applied the proposed methodology to a liquefied natural gas fuel gas supply system to verify its effectiveness in the reliability improvement of the design process.
