


1. Introduction
Blisk is a novel integrated structure of blade and disk widely used in the high propulsionaero-engine. Compared with traditional blades and disk systems, blisk has the advantages of being light weight and long-lasting and having a small amount of impulse, high efficiency, and superior reliability. Blisk is generally made of a titanium alloy with excellent high specific strength and corrosion resistance. The titanium alloy is a typical difficult-to-machine material, because it has low thermal conductivity, a small deformation coefficient, and high chemical activity. It is difficult to evacuate for the semi-closed structure of blisk; therefore, the cutting heat cannot be eliminated in time, leading to temperature rise, tool wear resistance decline, and cutting force increase. Raster modes for the ball-end mill and plunge milling forthe cylindrical end mill have also been usedin common millingblisk-tunnel;however, these methods have low efficiency, severe tool-wear, and high manufacturing cost. Therefore, disc-mill cutters are employed to millblisk-tunnel. This machining can increasethe material removal rateand reduce cost. The high material removal rate leads to an increasein the cutting force, so the cutting force needs to be controlled to ensure tool life and processing stability. Studying the sensitivity of machining parameters to the cutting force can enhance efficiency, extend cutter life, and reduce manufacturing costs [1-2].
Machining parameters, tool parameters, tool wear mechanisms, surface integrity, and cutting efficiency of various processing methods for titanium alloys have been researched. Some scholars have studied the influence of machining parameters on surface integrity. For instance, aiming at minimizing the surface roughness and burr formation, multi-objective optimization was made using a statistically based model and a particle swarm optimization method on micro milling TC4 by Thepsonthi et al. [3]. Some research works have focused on the effect of tool parameters on surface integrity, cutting force, and cutting heat. For example, the main tool geometry parameters that affect surface integrity of machining Ti-5Al-5Mo-5V-1Cr-1Fewere investigated by Ren et al. [4].
Abbasi et al. investigated the influence of changing the rake angle of the PCD insert on cutting forces, tool-chip interface temperature, and tool stresses and compared the results with a TiAIN coated carbide inserted end mill utilizing FEM. The result showed that the tool rake angle has significant influence and reveals a difference in the performance for the two kind of inserts [5]. Other researchers have analyzed tool wear mechanisms of machining titanium alloys. For instance, mechanisms of cutter wear for cemented carbides (coated and uncoated) and ceramic cutter turning IMT318 and C-Tiwere studied by Dearnleyet al[6]. Rashid et al. revealed mechanisms of tool wear and crater formation when high speed dry cutting TC4 with uncoated carbide cutters[7].
The aforementioned research works indicate that the influence of machining parameters on surface integrity, cutting force, cutting heat, etc., have gained comprehensive attention. However, research on the sensitivity analysis of process parameters is very limited. The goal of sensitivity analysis is to identify the significant and insignificant influence factors in design variables. Sensitivity analysis has two categories: local and global sensitivity analysis. Many studies have been done on local sensitivity analysis. For example, a simple common local sensitivity analysis method was presented by Verbeke et al. [8].Castillo et al. proposed a general approach for local sensitivity analysis, which is applied to a regression model and optimization problem [4]. Subsequently, a closed expression for local sensitivity analysis was presented by Castilloet al[9]. A hybrid local-global sensitivity analysis method was proposed and applied to a hydrologic model by Rakovec et al. Compared with the Sobol’index approach, both methods discerned comparable significant and insignificant parameters, where the hybrid method demonstrated more detailed insight with lower computational cost [10]. Local sensitivity analysis was developed based on a linear model and cannot provide accurate results when analyzing a nonlinear model. Therefore, the global sensitivity analysis was developed. The most commonly used methods of sensitivity analysis include polynomial regression, Morris screening method, Regionalized Sensitivity Analysis (RSA), general likelihood uncertainty estimation (GLUE), Fourier amplitude sensitivity (FAST), expanded Fourier amplitude sensitivity test (EFAST), and Sobol index method. Based on the Fourier amplitude sensitivity test, a new global sensitivity analysis approach was developed by Sudret et al. The two primary advantages of the approach are its robustness and high computing efficiency [11]. Li et al. proposed a new global sensitivity analysis method for systems whose inputs are independent and/or interrelated. The approach can be used to uncontrolled input variables [12].Tahmasbi et al. applied Sobol sensitivity analysis to study temperature and force in the robotic bone drilling process [13].To determine the most sensitive factor for the Tomgro model, the Sobol method was compared with expanded Fourier amplitude sensitivity by Vazquez-Cruz et al. [8].
In this paper, local and global sensitivity of processing parameters (cutting speed, feed rate per tooth, cutting height) for cutting force are analyzed in the process of disc-mill cutter machining TC17 blisk-tunnel. Section 2 introduces the approach of sensitivity analysis. Experimental procedures and results are given in Section 3. In Section 4, local and global sensitivity analysis of process parameters for cutting force are calculated, and stable and unstable regions of each parameter are acquired. Finally, conclusions are given in Section 5.
2. Sensitivity Analysis
Sensitivity means the sensitive degree of the design objective when design variables are changed. The goal of sensitivity analysis is to identify crucial and weak factors in design variables. According to the changed situation of variables and action range of sensitivity analysis, these methods can be divided into local and global sensitivity analysis. Local sensitivity analysis only examines the impact of changes of a single variable on the objective function. In contrast, global sensitivity analysis tests the total influence of several variables that are simultaneously changed and the interaction effects of variables on the objective function.
2.1.Local Sensitivity Analysis
In local sensitivity analysis, the differential of the output on input or output change caused by a single input variable change is regarded as the sensitivity index. Generally, local sensitivity analysis has high accuracy in a design space when calculating input-output relations around fixed point.
The degree of sensitivity reflects the gradient change of the objective function $f(x)$ to the design variable ${{x}_{i}}$. In a continuous system, if $f(x)$ is a differentiable function, its first-order sensitivity S can be represented as[14]:
2.2.Global sensitivity analysis
In global sensitivity analysis, the influence of each parameter and interaction of parameters are analyzed when several parameters simultaneously change. Global sensitivity analysis has two features:
$\cdot\$ The variation ranges of other parameters and the influence of probability distribution are considered.
$\cdot\$ The sensitivity of each input parameter is obtained through several input parameters varying at the same time.
Global sensitivity analysis can be applied to nonlinear and non-monotonic model. Global sensitivity analysis searches more design space for parameters and overcomes shortcomings of local sensitivity analysis, in which several parameters cannot change at the same time. Therefore, the results of global sensitivity analysis have greater adaptability.The Sobol index approach is a variance-based global sensitivity analysis. It evaluates the sensitivity of a single input and interaction of multiple inputs by computing the output variance contribution for a single input and multiple inputs [15].
The total variance of $f(x)$ is defined as:
In accordance with each decomposition in Equation (2), the partial variance of a single parameter and multiple parameters can be calculated by:
The sensitivity parameter is defined as:
The main effect index is defined as:
The total effect index is defined as:
The interactive effect index is defined as:
$S_{x_{i}}$ reflects the individual influence of variable ${{x}_{i}}$ on the variance of $Y$. $S_{{{x}_{i}}}^{T}$ displaysthe impact of the interaction between ${{x}_{i}}$ and the other variables on the variance of $Y$.
3. Experiment Procedures
3.1.Experimental Design
Cutting speed, feed rate per tooth, and axial or radial depth of cut are usually chosen as the control variables of milling when optimizing performance parameters. For the disc-mill cutter milling blisk-tunnel, the axial depth of cut is the width of the indexable insert. the radial depth of the cut depends on the feed rate per tooth, so the two variables cannot be chosen as the control variable.The cutting height that is the thickness of the blisk-tunnel impacts the cutting force; therefore, the cutting height is used as one of performance controlling variables. The ranges of the three performance controlling variables are listed in Table 1. An orthogonal experiment with three factors and five levels are adopted. Table 2 lists detailed parameters of 25 experiments.
Table 1. Process parameters and their levels
| Level | $v$(m/min) | ${{f}_{c}}$(mm/tooth) | ${{a}_{w}}$(mm) |
|---|---|---|---|
| 1 | 30 | 0.020 | 28 |
| 2 | 40 | 0.035 | 33 |
| 3 | 50 | 0.050 | 38 |
| 4 | 60 | 0.065 | 43 |
| 5 | 70 | 0.080 | 48 |
Table 2. Design of the experiment and cutting force
| No. | $v$(m/min) | ${{f}_{c}}$(mm/tooth) | ${{a}_{w}}$(mm) | $F$(N) |
|---|---|---|---|---|
| 1 | 30 | 0.020 | 28 | 1098.6 |
| 2 | 30 | 0.035 | 33 | 1246.8 |
| 3 | 30 | 0.050 | 38 | 1538.7 |
| 4 | 30 | 0.065 | 43 | 1808.6 |
| 5 | 30 | 0.080 | 48 | 2158.4 |
| 6 | 40 | 0.020 | 33 | 1127.4 |
| 7 | 40 | 0.035 | 38 | 1317.5 |
| 8 | 40 | 0.050 | 43 | 1577.9 |
| 9 | 40 | 0.065 | 48 | 1867.3 |
| 10 | 40 | 0.080 | 28 | 2249.3 |
| 11 | 50 | 0.020 | 38 | 1196.3 |
| 12 | 50 | 0.035 | 43 | 1398.5 |
| 13 | 50 | 0.050 | 48 | 1614.8 |
| 14 | 50 | 0.065 | 28 | 1915.7 |
| 15 | 50 | 0.080 | 33 | 2434.9 |
| 16 | 60 | 0.020 | 43 | 1239.3 |
| 17 | 60 | 0.035 | 48 | 1436.9 |
| 18 | 60 | 0.050 | 28 | 1651.7 |
| 19 | 60 | 0.065 | 33 | 2019.3 |
| 20 | 60 | 0.080 | 38 | 2591.8 |
| 21 | 70 | 0.020 | 48 | 1365.9 |
| 22 | 70 | 0.035 | 28 | 1508.2 |
| 23 | 70 | 0.050 | 33 | 1726.9 |
| 24 | 70 | 0.065 | 38 | 2187.1 |
| 25 | 70 | 0.080 | 43 | 2785.3 |
3.2.Experimental Design
The workpiece material is TC17 titanium alloy. The chemical composition and mechanical properties of TC17 are listed in Tables 3 and 4, respectively. The up-milling operation for disc milling was carried out with a coolant using the complex machine tool. The disc-mill cutter with an indexable insert has 39 teeth, and the cutter diameter is 420mm. Square cemented carbide indexable inserts were used. Table 5 illustrates the cutter detail parameters.Figure 1 displays the machining process of the blisk-tunnel.
Table 3. Chemical composition of TC17
| Al | Sn | Zr |
|---|---|---|
| 4.5%-5.5% | 1.6%-2.4% | 1.6%-2.4% |
| Mo | Cr | Ti |
| 3.5%-4.5% | 3.5%-4.5% | Balance |
Table 4. Mechanical features of TC17 (20°)
| ${{T}_{S}}$ (MPa) | ${{Y}_{S}}$ (MPa) | ${{E}_{m}}$ (GPa) | $E$(%) | $D\text{ (g/c}{{\text{m}}^{\text{3}}}\text{)}$ |
|---|---|---|---|---|
| 1120 | 1030 | 112 | 10 | 4.68 |
Table 5. Cutter and insert geometric parameters
| Number of teeth | Diameter(mm) | Thickness(mm) | Rake angle ${}^\circ $ | Flute length(mm) |
|---|---|---|---|---|
| 39 | 420 | 15 | 8 | 6 |
Figure 1.

Figure 1.
Cutting process for disc tools
A three coordinate dynamometer (9255B, Kistler) was fixed on the plate of the complex machine tool, and the workpiece was fixed onto the dynamometer platform using four 12-mm bolts. The cutting force signals were enlarged via a charge amplifier (5080, Kistler), which transformed using an A/D converter (PCIM-DAS1602/16, Kistler), and recorded on a computer with software (DEWESoftX2, Kistler). The data acquisition process for the cutting force is shown in Figure 2.
Figure 2.
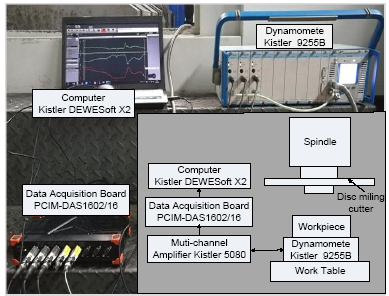
Figure 2.
Data acquisition process for disc tools
3.3. Experiment Results and Analysis
The relationship between the cutting force andprocess parameters was established using the quadratic regressive model. The quadratic regressive equation between the cutting force and process parameters is expressed as [18].
Sensitivity analysis between the process parameters and cutting force is carried out based on the regressive model. According tothe cutting force measured values of ${{L}_{25}}{{3}^{5}}$ orthogonal experiments, data analysis was performed on Design-Expert. The quadratic regression function between process parameters and cutting force can be written as:
To verify the significance of the regressive model, a series of analysis and testing are implemented including residual analysis, variance analysis, and predicted versus measured plot[18].Figures 3 and 4 show the residuals normal distribution and residuals run plot, respectively. It is found that data points reside around a straight line in Figure 3and data points are scattered in Figure 4. There is no specific distribution rule for data points in Figure 4. The predicted value versus the measured value plotis displayed in Figure 5, where the nearly-line distribution indicates that the predicted values ofthe model are correct.
Figure 3.
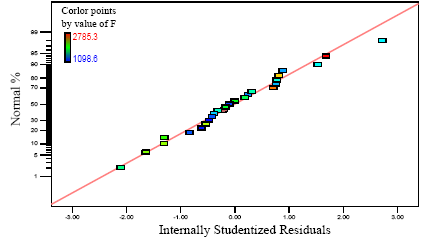
Figure 3.
Residuals normal distribution plot of cutting force
Figure 4.
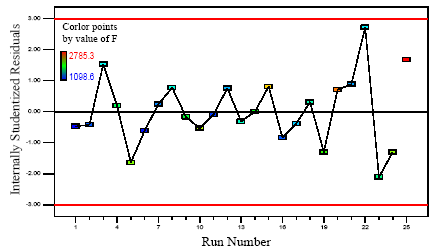
Figure 4.
Residuals run plot of cutting force test results
Figure 5.
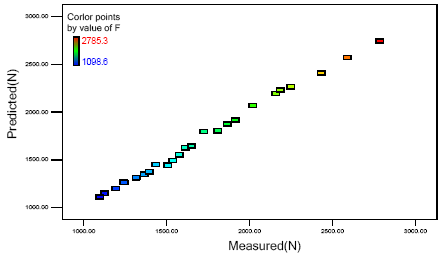
Figure 5.
Predicted versus measured plot
4. Sensitivity Analysis of Process Parameters
4.1.Local Sensitivity Analysis of Each Process Parameter
Local sensitivity means the sensitive degree of the response variable when only a single input variable changes. According tothe sensitivity definition, the sensitive degree model of the cutting force to machining parameters is represented as Equation (12) [19].
The cutting force model was obtainedby experiment.The initial process parameters are discrete points. Hence, the values of $v,$${{f}_{c}}\text{,}$ and ${{a}_{w}}$ in Equation(12) are set as average value of process parameters with $\overline{v}\text{=}50\text{m/min},$$\overline{{{f}_{c}}}\text{=}0.05\text{mm/tooth}$,and $\overline{{{a}_{w}}}\text{=}38\text{mm}.$
The sensitivity curves of the cutting speed, feed rate per tooth, and cutting height for the cutting force are shown in Figures 6, 7, and 8, respectively.
Figure 6.
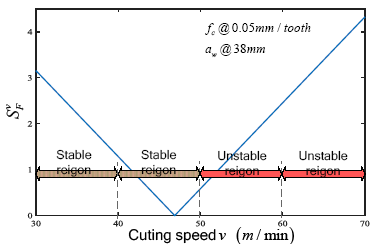
Figure 6.
Sensitivity curve of cutting speed
Figure 7.
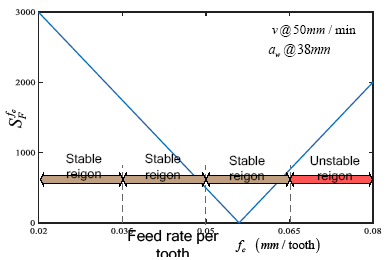
Figure 7.
Sensitivity curve of feed rate per tooth
Figure 8.
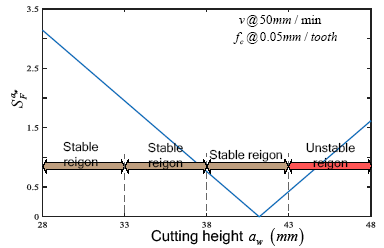
Figure 8.
Sensitivity curve of cutting height
The local sensitive degree of the cutting force to process parameters reflects the change rate of the cutting force in a certain process parameter range. Therefore, optimizing the interval of each process parameter can be achieved according to the sensitivity curve.
4.2.Stable and Unstable Region Analysis of Process Parameter
The stable region of process parameters is insensitive to the variation of process parameters, while the unstable region of process parameters is sensitive to the variation of process parameters in the range [19].
The orthogonal test has $n$ factors $\left( {{N}_{1}},{{N}_{2}},\cdots ,{{N}_{n}} \right)$ with $m$ levels $\left( {{M}_{1}},{{M}_{2}},\cdots ,{{M}_{m}} \right)$.The approach of division stable and unstable region of process parameters is written as[19]:
$\cdot\$ According to the single-parameter sensitivity curve, the amplitude change of sensitivity for each factor is calculated in the interval of $\left[ {{M}_{1}},{{M}_{2}} \right],\left[ {{M}_{2}},{{M}_{3}} \right],\cdots ,\left[ {{M}_{m-1}},{{M}_{m}} \right]$, which is denoted as ${{A}_{1}},{{A}_{2}},\cdots ,{{A}_{m-1}}$.
$\cdot\$ Compute the average value of $m-1$ amplitude changes of sensitivity. The average value is expressedas ${{A}_{0}}$. If ${{A}_{j}}\left( j=1, 2,\cdots , m-1 \right)>{{A}_{0}}$,$\left[ {{M}_{j}},{{M}_{j+1}} \right]$ is defined as an unstable region. If not, the interval is a stable region.
Based on the local sensitivity curve, the stable and unstable region of the cutting speed, feed rate per tooth, and cutting height can be obtained. The stable and unstable regions of the process parameters are outlined in Table 6. The stable regionsare: cutting speed with $\left[ 30, 50 \right]$, feed rate per tooth with $\left[ 0.02, 0.065 \right]$, and cutting height with $\left[ 28, 43 \right]$.The unstable region of the cutting speed, feed rate per tooth, and cutting height are $\left[ 50, 70 \right]$,$\left[ 0.065, 0.08 \right]$,and $\left[ 43, 48 \right]$,respectively.
Table 6. Stable and unstable regions of process parameters
| Process parameters | Stableregion | Unstable region |
|---|---|---|
| $v$ | $\left[ 30, 50 \right]$ | $\left[ 50, 70 \right]$ |
| ${{f}_{c}}$ | $\left[ 0.02, 0.065 \right]$ | $\left[ 0.065, 0.08 \right]$ |
| ${{a}_{w}}$ | $\left[ 28, 43 \right]$ | $\left[ 43, 48 \right]$. |
4.3. Global Sensitivity Analysis of Process Parameter
Local sensitivity can perfectly reflect the range of response variables when only one input variable changes, but it does not synthetically reflect the sensitive degree of the input variable. Global sensitivity can do so. The Sobol index method is adopted to calculate global sensitivity in the paper. The input of the Sobol method followsa uniform distribution in the interval of $\left[ 0, 1 \right]$[3]. Thus, the input variables need to be standardized. The process parameters and cutting forceare normalized to ${{y}_{1}}$, ${{y}_{2}}$,${{y}_{3}}$, and ${F}'$, as shown in Table 7. The second-order regression model of the cutting force becomes:
Table 7. Standardized data
| No. | ${{y}_{1}}$ | ${{y}_{2}}$ | ${{y}_{3}}$ | ${F}'$. |
|---|---|---|---|---|
| 1 | 0 | 0 | 0 | 0.0000 |
| 2 | 0 | 0.25 | 0.25 | 0.0879 |
| 3 | 0 | 0.5 | 0.5 | 0.2609 |
| 4 | 0 | 0.75 | 0.75 | 0.4209 |
| 5 | 0 | 1 | 1 | 0.6283 |
| 6 | 0.25 | 0 | 0.25 | 0.0171 |
| 7 | 0.25 | 0.25 | 0.5 | 0.1298 |
| 8 | 0.25 | 0.5 | 0.75 | 0.2842 |
| 9 | 0.25 | 0.75 | 1 | 0.4557 |
| 10 | 0.25 | 1 | 0 | 0.6822 |
| 11 | 0.5 | 0 | 0.5 | 0.0579 |
| 12 | 0.5 | 0.25 | 0.75 | 0.1778 |
| 13 | 0.5 | 0.5 | 1 | 0.3060 |
| 14 | 0.5 | 0.75 | 0 | 0.4844 |
| 15 | 0.5 | 1 | 0.25 | 0.7923 |
| 16 | 0.75 | 0 | 0.75 | 0.0834 |
| 17 | 0.75 | 0.25 | 1 | 0.2006 |
| 18 | 0.75 | 0.5 | 0 | 0.3279 |
| 19 | 0.75 | 0.75 | 0.25 | 0.5459 |
| 20 | 0.75 | 1 | 0.5 | 0.8853 |
| 21 | 1 | 0 | 1 | 0.1585 |
| 22 | 1 | 0.25 | 0 | 0.2428 |
| 23 | 1 | 0.5 | 0.25 | 0.3725 |
| 24 | 1 | 0.75 | 0.5 | 0.6453 |
| 25 | 1 | 1 | 0.75 | 1.0000 |
$\cdot\$ Define upper and lower bounds of the input variable of ${{y}_{i}}$.
$\cdot\$ Generate the value range of the input set.
$\cdot\$ Take the cutting force model of Equation(13) into the input set.
$\cdot\$ Calculate the sensitivity modulus of the main effect, total effect, and interactive effect using Equations(7),(8), and (9), respectively.
$\cdot\$ Analyze the sensitivity modulus.
Table 8 gives the main and total effects of the sensitivity index of the cutting speed, feed rate per tooth, and cutting height for cutting force. The main effect sensitivity indexes are: cutting speed with 0.3258, feed rate per tooth with 0.5860, and cutting height with 0.0451.The total effect sensitivity modulus of the cutting speed, feed rate per tooth, and cutting height are 0.3403, 0.6020, and 0.0510, respectively. The sensitivity modulus of the feed rate per tooth and cutting speed for cutting force are fairly larger, while the cutting height is relatively lower. This indicates that the feed rate per tooth and cutting speed have agreater impact on the cutting force, where as the cutting force is not sensitive to the cutting height. Meanwhile the difference between the main effect and total effect for the cutting speed and feed rate per tooth are bigger, showing that the cutting speed and feed rate per tooth interact with other process parameters. The difference for the cutting height is comparatively smaller, and it can be found that the interaction between the cutting height and the other process parameters is not significant.
Table 8. Sensitivity index of process parameters for cutting force
| Process parameters | Main effect ${{S}_{{{y}_{i}}}}$ | Total effect $S_{{{y}_{i}}}^{T}$ | Difference value |
|---|---|---|---|
| ${{y}_{1}}$ | 0.3258 | 0.3403 | 0.0145 |
| ${{y}_{2}}$ | 0.5860 | 0.6020 | 0.0160 |
| ${{y}_{3}}$ | 0.0451 | 0.0510 | 0.0059 |
5. Conclusions
Global sensitivity and single-parameter sensitivity of the process parameters for thedisc-mill cutter machining blisk-tunnel are analysed in the paper. The stable and unstable regions of process parameters are determined. Conclusions can be drawn as follows:
$\cdot\$ The cutting force for the disc-mill cutter machining blisk-tunnel is sensitive to the cutting speed and feed rate per tooth.There exists a remarkable interaction between cutting speed, feed rate per tooth, and cutting height on cutting force.
$\cdot\$ The local sensitivity of all parameters is firstly declined, and the sensitivity is increased once the parameters are larger than the given size.
$\cdot\$ For the cutting force of the disc-mill cutter machining blisk-tunnel, the stable regions are: cutting speed with $\left[ 30, 50 \right]$, feed rate per tooth with $\left[ 0.02, 0.065 \right]$, and cutting height with $\left[ 28, 43 \right]$.
Acknowledgements
This work was partially supported by the National Natural Science Foundation of China (No. 71761030).
Reference
“Robust Control of the A-Axis with Friction Variation and Parameters Uncertainty in Five-Axis CNC Machine Tools, ”
“Proportional-Integral based Fuzzy Sliding Mode Control of the Milling Head, ”
DOI:10.1016/j.conengprac.2016.04.012
URL
[Cited within: 1]

61The milling head with high-precision, high-torque and high-stiffness is proposed.61Fuzzy sliding mode control based on the proportional-integral control is designed.61The designed control strategy is verified by the simulations and experiments.
“Multi-Objective Process Optimization for Micro-End Milling of Ti-6Al-4V Titanium Alloy, ”
DOI:10.1007/s00170-012-3980-z
URL
[Cited within: 2]
AbstractMicro-end milling is one of the promising methods for rapid fabrication of features with 3D complex shapes. However, controlling the micro-end milling process to obtain the desired results is much harder compared to that of macro-end milling due to the size effect and uncontrollable factors. The problem is much pronounced when workpiece material is a difficult-to-process material such as titanium-based alloys which are widely used as material of choice for aircraft structures, turbine blades, and medical implants. In order to find the optimal process parameters which minimize the surface roughness and burr formation, experiments were conducted and models obtained with statistically based methods utilized in multi-objective particle swarm optimization to identify optimum process parameters. The results show that the average surface roughness can be minimized while burr formation is reduced concurrently.
“Evaluation of Principal Wear Mechanisms of Cemented Carbides and Ceramics used for Machining Titanium Alloy IMI 318, ”
DOI:10.1179/mst.1986.2.1.47
URL
[Cited within: 2]
Although significant advances in tool material development have been made to facilitate increased metal removal rates when turning steels and cast irons, no equivalent developments have been made for cutting titanium alloys. In this paper, part of a recent research programme is described in which the principal wear mechanisms of ceramic and cemented carbides (coated and uncoated) used for turning Ti0900096AI0900094V (IMI 318) and commercial purity titanium are investigated. A significant problem is the generation of rake face temperatures above 90000°C at relatively low cutting speeds, i.e. ~75 m min090808I, which promote rapid rake face crater wear by dissolution090009diffusion. Of all the tool materials tested, it was the 090004straight090004 grade (WC090009Co) cemented carbides which were most resistant to this type of wear. They also offered superior resistance to flank wear induced by attrition. Experiments in which cubic boron nitride was used and comparative tests with TiB2 and TiC coated carbides, in conjunction with solubility considerations, suggest that boron090009based tool materials have significant potential for combating wear caused by dissolution090009diffusion.
“Analysis and Optimization of Cutter Geometric Parameters for Surface Integrity in Milling Titanium Alloy Using a Modified Grey-Taguchi Method, ”
“Evaluating the Effect of PCD and TiAIN Coated Carbide End Mill’s Rake Angle on Machinability of Titanium Alloy TÃ-6AI-4V, ”
DOI:10.4028/www.scientific.net/AMR.1025-1026.564
URL
[Cited within: 1]
This study evaluates the machinability of titanium alloy, Ti6Al4V in terms of tool-chip interface temperature, cutting forces and tool stresses by varying rake angle of <i>PCD</i> insert and compares the results with <i>TiAlN</i> coated carbide inserted end mill using finite element numerical simulations. It has been found that tool rake angle has significant effect and behaves differently for different evaluation parameters and also shows different behavior for two different cutting material inserts. It reduces cutting forces with every positive angle geometry, about 50% reduction is observed for both cutting tool materials for a change in angle from-7° to 34°, but for tool-chip interface temperature, 15% reduction has been observed when angle is changed from-7° to 15° but it starts rising again when angle is increased to 34° for PCD insert, but for TiAlN coated carbide insert a continuous drop of about 20% has been observed. For tool stresses tool rake angle has different effect. The stresses remains almost unchanged when angle is changed from-7° to 15° but increased by almost 20% when angle is changed to 34° for both insert materials. Results also have shown that PCD insert due to its excellent thermal conductivity and strength at elevated temperatures dissipates most of the heat into the chip and has almost half temperature near the tool edge as compared to <i>TiAlN</i> coated carbide insert and thus can be used for machining of Ti6Al4V alloy at much higher cutting speeds than <i>TiAlN</i> coated carbide insert with positive rake angle geometries (around 15°).
“Tool Wear Mechanisms Involved in Crater Formation on Uncoated Carbide Tool When Machining Ti6al4v Allo, ”
DOI:10.1007/s00170-015-7668-z
URL
[Cited within: 1]
When machining titanium alloys at cutting speeds higher than 60m/min using cemented carbide cutting tools, the tool wears out rapidly. With the ever-increasing use of titanium alloys, it is essential to address this issue of rapid tool wear in order to reduce manufacturing costs. Therefore, the intention of this study was to investigate all possible tool wear mechanisms involved when using uncoated carbide cutting tools to machine Ti6Al4V titanium alloy at a cutting speed of 150m/min under dry cutting conditions. Adhesion, diffusion, attrition, and abrasion were found to be the mechanisms associated with the cratering of the rake surface of the cutting tool. The plastic deformation of the cutting edge was also noticed which resulted in weakening of the rake surface and clear evidence has been presented. Based on this evidence, the process of the formation of the crater wear has been described in detail.
“Global Sensitivity Analysis by Means of Efast and Sobol’Methods and Calibration of Reduced State-variable Tomgro Model Using Genetic Algorithms, ”
DOI:10.1016/j.compag.2013.10.006
URL
[Cited within: 2]
One common constraint for using crop models for decision making in precise greenhouse crop management is the need for accurate values of model parameters depending on climate conditions, crop varieties, and management. Estimating these parameters from observed data on the crop, using a crop model, is an interesting possibility. Nevertheless, the accuracy of estimations depends on the sensitivity of the model output variables to the parameters. Therefore, this paper proposes the use of the reduced state variable TOMGRO model which describes nodes, leaf area index, total plant weight, total fruit weight, and mature fruit weight as states variables. The objective of this work was to compare EFAST and Sobol sensitivity analysis methods to determine the most sensitive parameters for TOMGRO model outputs. A former sensitivity analysis showed that 8 parameters were the most sensitive and they were calibrated using genetic algorithms (GAs) to adapt the model to semi-arid weather conditions of Central Mexico. Genetic algorithms are important heuristic search algorithms for optimization problems and have been used to calibrate non-linear models related to control of greenhouse climate conditions. Simulation and analysis of the TOMGRO model showed that the estimations for the state variables are close to the measured data. The model could be adapted for simulating other greenhouse crops by means of sensitivity analysis and calibration.
“A General Method for Local Sensitivity Analysis with Application to Regression Models and Other Optimization Problems, ”
DOI:10.1198/004017004000000509
URL
[Cited within: 1]
This article introduces a method for sensitivity analysis of general applicability. The method is based on the well-known duality property of mathematical programming, which states that the partial derivatives of the primal objective function with respect to the constraints on the right side parameters are the negative of the optimal values of the dual problem variables. For the parameters or data, for which sensitivities are sought, to appear on the right side, they are converted into artificial variables and set to their actual values, thus obtaining the desired constraints. The method is applicable to linear and nonlinear models, to normal and nonnormal models, and to least squares and other methods of estimation. In addition to its general applicability, the method is also computationally inexpensive, because the necessary information becomes available without extra calculations. The theoretical basis for the method is given and illustrated by its application to least squares, least absolute value, and minimax regression problems and to the estimation of a Weibull distribution from censored data.
“A Quantitative Model-Independent Method for Global Sensitivity Analysis of Model Output, ”
DOI:10.1080/00401706.1999.10485594
URL
[Cited within: 1]
A new method for sensitivity analysis (SA) of model output is introduced. It is based on the Fourier amplitude sensitivity test (FAST) and allows the computation of the total contribution of each input factor to the output''s variance. The term 090008total090009 here means that the factor''s main effect, as well as all the interaction terms involving that factor, are included. Although computationally different, the very same measure of sensitivity is offered by the indices of Sobol''. The main advantages of the extended FAST are its robustness, especially at low sample size, and its computational efficiency. The computational aspects of the extended FAST are described. These include (1) the definition of new sets of parametric equations for the search-curve exploring the input space, (2) the selection of frequencies for the parametric equations, and (3) the procedure adopted to estimate the total contributions. We also address the limitations of other global SA methods and suggest that the total-effect indices are ideally suited to perform a global, quantitative, model-independent sensitivity analysis.
“Global Sensitivity Analysis Using Polynomial Chaos Expansions, ”
DOI:10.1016/j.ress.2007.04.002
URL
[Cited within: 1]
Global sensitivity analysis (SA) aims at quantifying the respective effects of input random variables (or combinations thereof) onto the variance of the response of a physical or mathematical model. Among the abundant literature on sensitivity measures, the Sobol’ indices have received much attention since they provide accurate information for most models. The paper introduces generalized polynomial chaos expansions (PCE) to build surrogate models that allow one to compute the Sobol’ indices analytically as a post-processing of the PCE coefficients. Thus the computational cost of the sensitivity indices practically reduces to that of estimating the PCE coefficients. An original non intrusive regression-based approach is proposed, together with an experimental design of minimal size. Various application examples illustrate the approach, both from the field of global SA (i.e. well-known benchmark problems) and from the field of stochastic mechanics. The proposed method gives accurate results for various examples that involve up to eight input random variables, at a computational cost which is 2–3 orders of magnitude smaller than the traditional Monte Carlo-based evaluation of the Sobol’ indices.
“Global Sensitivity Analysis for Systems with Independent and/or Correlated Inputs, ”
DOI:10.1016/j.sbspro.2010.05.131
URL
PMID:20420436
[Cited within: 1]
A new unified global sensitivity analysis framework is introduced for systems whose input probability distribution can be independent and/or correlated. For correlated inputs, three sensitivity indices are defined to fully describe the total, structural (reflecting the system structure) and correlative (reflecting the correlated input probability distribution) contributions for an input or a subset of inputs. The magnitudes of all three indices need to be considered in order to quantitatively determine the relative importance of the inputs. For independent inputs, these indices reduce to a single index consistent with previous variance-based methods. This analysis is especially useful for the treatment of laboratory and field data.
“Sensitivity Analysis of Temperature and Force in Robotic Bone Drilling Process Using Sobol Statistical Method, ”
DOI:10.1080/13102818.2017.1403863
URL
[Cited within: 1]
Abstract The bone drilling process is indispensable in orthopaedic surgeries and treating bone breakages. It is also very important in dentistry and bone sampling operations. Bone is a very complex material and the process of drilling is very sensitive. Thus, bone drilling is one of the most important, common in the field of biomedical engineering. The bone drilling process can be promoted using automatic drilling machines and surgery-assisting robots. The problematic issue during operation is the high increase in drilling process temperature (higher than 47 C) which leads to the so-called hermal necrosis or cell death, and local burn in bone tissue. Furthermore, imposing higher forces to bone might yield to breaking or cracking, and consequently causes serious damages in bone. In this paper, the tool rotational speed, feed ratio and tool diameter were taken into account as process input parameters, and process temperature and thrust force were taken as output parameters. Design of experiments using response surface methodology was followed. Then, second linear governing equation was assigned to the model and its accuracy was evaluated. Later, Sobol statistical sensitivity analysis was used to ascertain the effect of process input parameters on process temperature and force. The results showed that among all effective input parameters, the tool rotational speed, feed rate and tool diameter have the highest influence respectively on process temperature and force. The behaviour of each output parameter with variation in each input parameter was further investigated.
“Sensitivity Analysis for Nonrandom Dropout: A Local Influence Approach, ”
“An Efficient Modularized Sample-based Method to Estimate the First-Order Sobol’ Index, ”
DOI:10.1016/j.ress.2016.04.012
URL
[Cited within: 1]
61An efficient method to estimate the first-order Sobol07 index.61Estimate the index from input–output samples directly.61Computational cost is not proportional to the number of model inputs.61Handle both uncorrelated and correlated model inputs.
“Sensitivity Analysis of Environmental Models:A Systematic Review with Practical Workflow, ”
DOI:10.1016/j.envsoft.2016.02.008
URL
[Cited within: 2]
61We present an overview of SA and its link to uncertainty analysis, model calibration and evaluation, robust decision-making.61We provide a systematic review of existing approaches, which can support users in the choice of an SA method.61We provide practical guidelines by developing a workflow for the application of SA and discuss critical choices.61We give best practice examples from the literature and highlight trends and gaps for future research.
“A Fully Multiple‐Criteria Implementation of the Sobol’Method for Parameter Sensitivity Analysis, ”
DOI:10.1029/2011JD016355
URL
[Cited within: 1]
[1] We present a novel rank-based fully multiple-criteria implementation of the Sobol090005 variance-based sensitivity analysis approach that implements an objective strategy to evaluate parameter sensitivity when model evaluation involves several metrics of performance. The method is superior to single-criterion approaches while avoiding the subjectivity observed in 090008pseudo090009 multiple-criteria methods. Further, it contributes to our understanding of structural characteristics of a model and simplifies parameter estimation by identifying insensitive parameters that can be fixed to default values during model calibration studies. We illustrate the approach by applying it to the problem of identifying the most influential parameters in the Simple Biosphere 3 (SiB3) model using a network of flux towers in Brazil. We find 2709000931 (out of 42) parameters to be influential, most (09080478%) of which are primarily associated with physiology, soil, and carbon properties, and that uncertainties in the physiological properties of the model contribute most to total model uncertainty in regard to energy and carbon fluxes. We also find that the second most important model component contributing to the total output uncertainty varies according to the flux analyzed; where as morphological properties play an important role in sensible heat flux, soil properties are important for latent heat flux, and carbon properties (mainly associated with the soil respiration submodel) are important for carbon flux (as expected). These distinct sensitivities emphasize the need to account for the multioutput nature of land surface models during sensitivity analysis and parameter estimation. Applied to other similar models, our approach can help to establish which soil-plant-atmosphere processes matter most in land surface models of Amazonia and thereby aid in the design of field campaigns to characterize and measure the associated parameters. The approach can also be used with other sensitivity analysis procedures that compute at least two model performance metrics.
“Optimization of Parameter Ranges for Composite Tape Winding Process based on Sensitivity Analysis, ”
DOI:10.1007/s10443-016-9553-9
URL
[Cited within: 3]
Abstract This study is focus on the parameters sensitivity of winding process for composite prepreg tape. The methods of multi-parameter relative sensitivity analysis and single-parameter sensitivity analysis are proposed. The polynomial empirical model of interlaminar shear strength is established by response surface experimental method. Using this model, the relative sensitivity of key process parameters including temperature, tension, pressure and velocity is calculated, while the single-parameter sensitivity curves are obtained. According to the analysis of sensitivity curves, the stability and instability range of each parameter are recognized. Finally, the optimization method of winding process parameters is developed. The analysis results show that the optimized ranges of the process parameters for interlaminar shear strength are: temperature within [100 C, 150 C], tension within [275 N, 387 N], pressure within [800 N, 1500 N], and velocity within [0.2 m/s, 0.4 m/s], respectively.
“Analysis of Factor Sensitivity in Brake Friction and Wear Performance based on the Sobol Method, ”
DOI:10.1007/s40430-018-1269-3
URL
[Cited within: 1]
To analyse the influence of material parameters and the working condition on the friction and wear performance of brakes with less test data, the Sobol method is employed to obtain factor...
