


1. Introduction
Gear transmission systems play an important role in system safety and the operation reliability of machines. Contact fatigue is one of the main forms of gear failure, and it causes the transmission vibration to be violent and becomes an early indication of other faults. It is the important to accurately evaluate the contact damage status and remaining useful life for contact fatigue.
In degradation process analysis, the two main methods are data-driven and model-driven. The former is based on the stochastic process theory, while the latter is based on a physics mechanism. Chen et al. [1] combined historical data with vibration signals using the Bayesian method to assess the degradation of the bearing and predict the residual life. Wang et al. [2] presented an intelligent prognostic system to assess the degradation of the gears based on the data driven method. However, this method cannot make full use of the mechanism of gear operation analysis. Aouabdi et al. [3] made use of the motor current signal to research the gear tooth pitting by multi-scale entropy and principal component analysis. Guilbault et al. [4] researched the concurrent faults during degradation process for gears and put forward indicators corresponding to some faults. Wan et al. [5] extracted the redundant statistical features using binary wavelet packet transform to identify the degradation level for gear crack. Wang et al. [6] reviewed the PHM research works of bearing and gear on health indicators based on vibration signals, including the research results of the degradation process of gear systems presented by many researchers so far. Almost all the works reviewed above follow a data-driven approach to the degradation process, and some even focus on fault diagnosis rather than degradation processes. In recent years, more and more research involving a model-driven approach has been performed with the development of mechanism investigation. Zhao et al. [7] proposed a new evaluation method combining dynamic analysis, crack growth, finite element analysis, and reliability computation to analyze the degradation process of the gears. This is a more precise approach with a variety of technologies, so the cost of computation is high. Considering the necessity of mechanism study, some researchers have further analyzed the dynamic response and nonlinear oscillation of gear pair systems. Farshidianfar et al. [8] researched the global bifurcation and routes to chaos for several parameters in a spur gear pair system. A Fourier series was employed to describe how the input torque of the model fluctuates between low and high values. Wang et al. [9] proposed a quasi-static nonlinear analysis method that can slice the transit process into a several steady process to investigate the nonlinear characteristics of the gearbox of the urban rail vehicles. Hammami et al. [10] put forward a dynamic model of planetary gear system on the variable loading conditions and then verified the model through simulation results and experimental data. Chen et al. [11] researched the vibration feature of locomotives with tooth crack propagation of the gear pair system through the locomotive-track coupled dynamic model and revealed the effect of dynamic response under different crack depth. Liang et al. [12] reviewed related research works on dynamic modeling of gear systems with faults, including gear tooth cracking, pitting, wear, chipping, manufacturing errors, and misalignment. Itwas pointed out that comprehensive modeling of the gearbox degradation process is one of the main research prospects.
Gear contact fatigue is a disorderly behavior that is due to gear separation phenomenon, which is caused by nonlinear backlash. Spitas et al. [13] introduced an in-depth study on the intermittent gear contacts problem arising from variable load conditions and nonlinear backlash under fixed-speed conditions, and they explored the dynamic response of drive side engaging, idling, and coast side engaging. According to the conventional method to evaluate the contact fatigue of gears, the non-linear motion of gear system is neglected, and the evaluation of gear contact fatigue is caused by a large error. In this paper, a contact damage-torsional vibration coupling dynamic model of gear systems is presented to analyze the contact fatigue behavior of gears during dynamic operation.
This paper organized as follows: Section 2 describes the contact damage-torsional vibration coupling dynamic model in detail. Section 3 introduces the investigation framework of the degradation process of gear contact. Section 4 analyzes and discusses the simulation results and predicts the lifetime of gears. Section 5 presents the conclusions and suggestions for future works.
2. Contact Damage-Torsional Vibration Coupling Dynamic Model of Gear System
2.1. Torsional Vibration Model of Gear System
In the operation of gears, the transmission process is torsional vibrating because of the influence of internal and external excitations. The torsional vibration topology of the gear system is shown in Figure 1. Considering the influence of nonlinear backlash, time varying meshing stiffness, and meshing damping, the torsional vibration model of gear system can be written as follows:
Where I1 and I2 are the moment of the inertia of gears a and b, respectively,c is the meshing damping, k(t) is the time-varying meshing stiffness,T1 is the driving moment, and T2 is the resistance moment.
Figure 1.
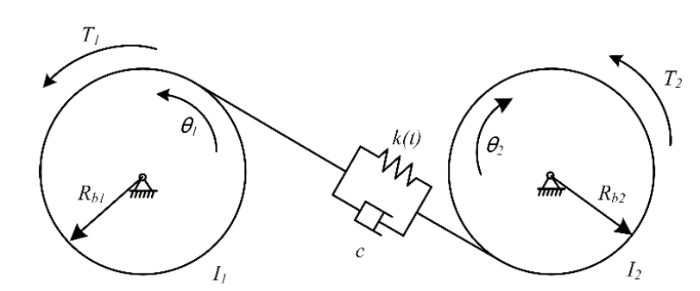
Figure 1.
Motion model of gear torsional vibration
The function $f(\cdot )$ represents the non-linear relation in the process of gear torsional vibration, which is caused by the backlash of the gear system to ensure the smoothness of transmission. Because of the design of the gear backlash, the gears will produce three different meshing states in the meshing process, namely, the driving side contact, the idle, and the coasting side contact. The nonlinear backlash function can be written as
Where b is the backlash.
Time-varying meshing stiffness is an important internal excitation to generate the periodic motion of the gear system. There are many methods for calculating meshing stiffness, such as the Ishikawa method, ISO method, finite element method, and potential energy method. In this paper, we use the potential energy method to calculate the time-varying meshing stiffness, due to its clear scientific thinking and accurate computation results. From reference [14], bending potential energy, axial compressive potential energy, shear potential energy, and Hertzian potential energy are considered to analyze the meshing stiffness.
In this paper, we only study the dynamic response of the gear system under a fixed-speed condition. Therefore, we can obtain the relationship between two external excitations as follows:
Where ig=Z1/Z2, Z1 and Z2 are the tooth numbers of gearsa and b, respectively.
Defining the static transmission error as $x={{r}_{a}}{{\theta }_{a}}-{{r}_{b}}{{\theta }_{b}}$, the coupling equation of torsional vibration can be obtained by (1a) and (1b):
Where $m={{{I}_{1}}{{I}_{2}}}/{\left( {{I}_{1}}{{R}_{b2}}^{2}+{{I}_{2}}{{R}_{b1}}^{2} \right)}\;$ and ${{F}_{T}}=m\left[ {{{T}_{1}}{{R}_{b1}}}/{{{I}_{1}}}\;+{{{T}_{2}}{{R}_{b2}}}/{{{I}_{2}}}\; \right]$.
Based on the dynamic results, the contact force can be computed as follows:
The Hertzian stiffness KH can be written as follows:
Where E is Young’s Modulus, ν is the Poisson ratio, and L is the tooth thickness.
2.2. Contact Stress Model
The contact behavior in the periodic rotational motion of the gear system is the main factor causing tooth surface contact fatigue. The gear contact behavior is assumed to be contact with two cylinders near the contact point, as shown in Figure 2. According to Hertzian contact theory, the half of the width of the two cylinders’ contact surface is given in reference [15]
As can be seen from Figure 3, r1 and r2 are not only the radii of the two cylinders, but also the lengths of the generating lines of the contact points, which vary with the rotation of the gears. At any definite angle, the lengths can be written respectively as
Figure 2.
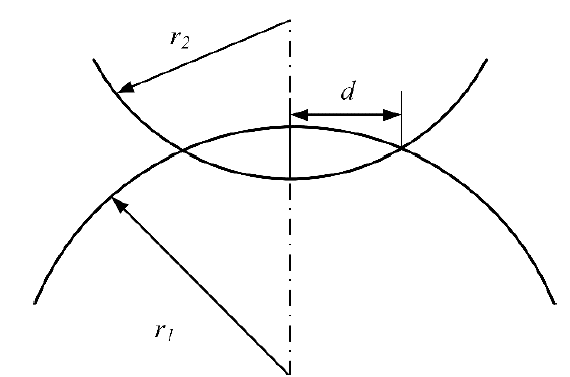
Figure 2.
Gear contact topological structure
Figure 3.
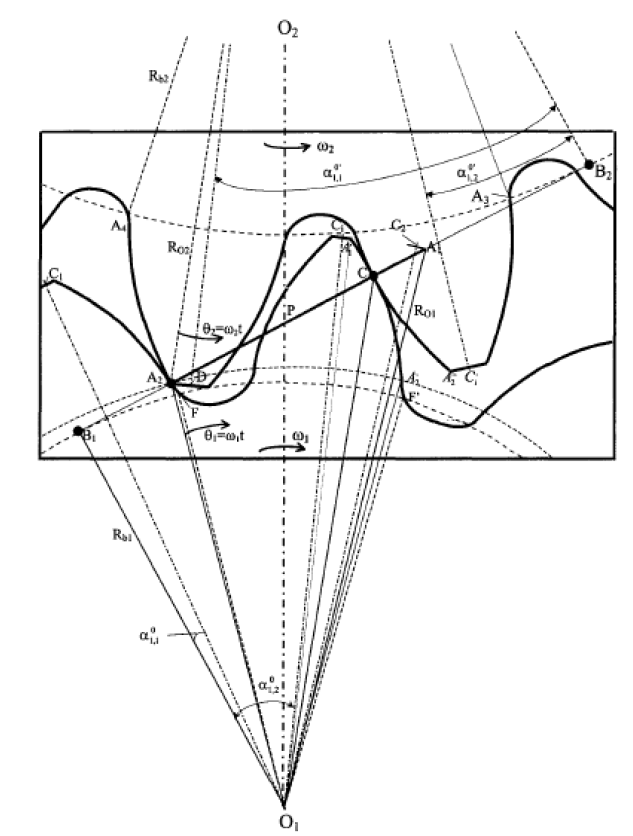
Figure 3.
Geometrical relation of gear contact
Where α1 and α2 are the pressure angles of the meshing position.
The pressure angle at any definite angle varies with the angular displacement of the gear system because the gear radius of the contact point is changed. It is reasonable to consider the pressure angle as composed of the initial pressure angle and rotational angular displacement. The expression of the pressure angle can be written as follows:
Where $\overline{{{\theta }_{1}}}$ is the nominal angular displacement of gear a without considering torsional vibration, which is computed as angular velocity multiplied by time.
From Figure 3, the pressure angle of gear a in the initial meshing can be calculated by an inverse trigonometric function based on the geometrical relation as follows:
Where Rb1 and Rb2are the base circle radii of gears 1 and 2, respectively. Ra2 is the addendum circle radius of gear 2. Through the geometrical relation of gear meshing, the length of $\overline{{{O}_{1}}{{A}_{2}}}$ can be obtained easily as follows:
where $\angle {{O}_{1}}{{O}_{2}}{{A}_{2}}=\arccos {{{R}_{b2}}}/{{{R}_{a2}}}\;-{{\alpha }_{0}}$, $\overline{{{O}_{1}}{{O}_{2}}}={{R}_{r1}}+{{R}_{r2}}$, α0 is the pressure angle of the reference, and Rr1 and Rr2are the reference circle radii.
According to Hertzian contact theory, it is reasonable to assume that the contact area is a rectangular area. Based on the above analysis, the contact area can be calculated simply and the contact stress of meshing position can be written as follows:
2.3. Contact Damage Model
The degradation model in this paper adopts an S-N curve as the contact damage model to predict the lifetime of the gears, which may be influenced by the load ratio, manufacturing process, material quality, etc. Therefore, the error term is employed into the standard S-N curve and denoted by ε. The modified S-N curve considering parameter uncertainty can be expressed as follows:
Where C and mare the parameters of the S-N curve, S is the stress amplitude under the alternative cycle, andN is the conditional lifetime corresponding to stress level S. In addition, the error of lifetime can be assumed to follow a normal distribution as follows:
The contact behavior can be decomposed into the damage caused by contact stress in many pulsating cycles. Before calculating the contact damage, we should use the Goodman formula to convert the load under the pulsating cycle to the load under the alternating cycle to ensure the accuracy of the evaluation. Then, the damage caused by contact at any time can be calculated as
Further, the remaining useful life of the gears can be predicted as follows:
Where Ts is the simulation time.
3. Simulation Framework
Due to the introduction of uncertainty into the model, the calculation process of the damage for gears becomes a statistical inference. It is difficult to obtain the exact analytical solution or even a numerical solution. Fortunately, the contact fatigue calculated by the S-N curve has no obvious effect on the gear dynamics, because only the stage of crack initiation is considered. In this paper, we propose a sequential scheme combining the Monte Carlo algorithm and numerical algorithm to estimate the degradation process of gears, instead of a single numerical algorithm. Figure 4 illustrates the investigation framework of the iterative scheme in detail.
Figure 4.
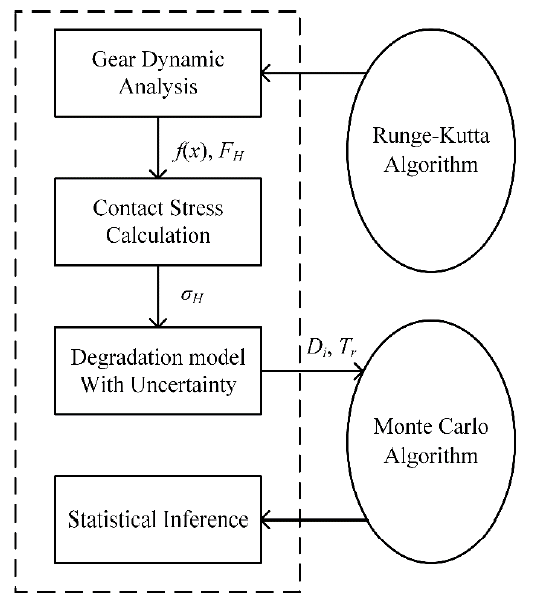
Figure 4.
Simulation framework of degradation process analysis of gear system
Firstly, the dynamic response of the gear system is calculated by the Runge-Kutta algorithm to output the gear state and the Hertzian force. Then, the contact stress at any contact position is calculated. Furthermore, a degradation model analyzing lifetime is produced by random sampling from the parameters in the S-N curve. Finally, the degradation trajectory of gears is estimated by the Monte Carlo method.
For this study, the simulation is performed using MATLAB software based on the framework proposed above. In order to simulate the degradation process more accurately, the sampling number is set to 1000 for statistical inference. Table 1 lists all the parameters required for simulation in this paper. We choose the gear pair applied in the subway vehicle gearbox to explore the degradation process.
Table 1. Gear pair parameter details
| Specification | Value |
|---|---|
| Tooth number of gear 1 and 2 | 22/133 |
| Pressure angle | 20° |
| Module | 5 |
| Addendum coefficient | 1.1 |
| Moments of inertia of gear 1 and 2 | 0.0077/8.96 |
| Backlash | 0.343 |
| Tooth thickness | 60 |
| Parameter of S-N curve m | 8.23 |
| Parameter of S-N curve C | 1.37×1033 |
| Parameter of normal distribution τ | 0.05 |
4. Simulation and Result
In this paper, three different rotational speeds are chosen to assess the degradation process of the gear system, and the first gear teeth of gear 1 is set as the research subject. As shown in Figure 5, the contact damage of the five points on the first gear teeth are investigated based on the method proposed.
Figure 5.
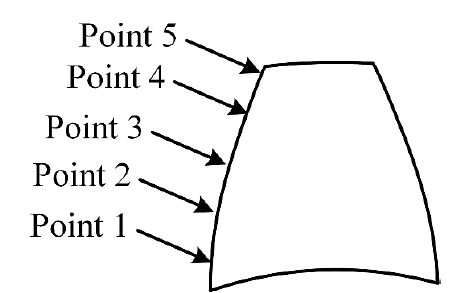
Figure 5.
Position detail on gear teeth in simulation
Figure 6 shows the contact stress of the gear system at each point whenn=1000, wherein the horizontal axis represents the cycle of rotations of gear 1. As a whole, the contact state of the gears at this rotational speed is relatively stable and is the driving side contact. It is obvious that the mean contact stress of point 5 is the highest, reaching nearly 100MPa, while point 1 is the lowest, at approximately 50MPa. Moreover, the mean contact stress of point 2 is about the same as that of point 4, about 65MPa.
Figure 6.
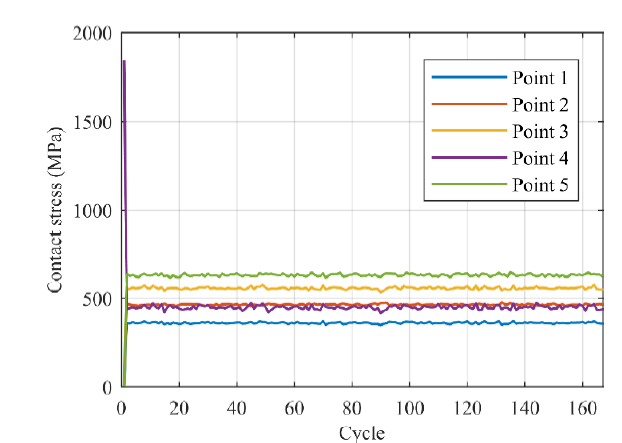
Figure 6.
Contact stress for five points withn=1000
Figure 7 and Figure 8 illustrate the degradation process of the gear system with n=1000. As we can see from Figure 7, the lifetime of gear contact fatigue under this condition is about 2.2×10⁵ h and the remaining useful life of point 5 decreases smoothly because the fluctuation at this point with low rotational speed is small. Figure 8 shows that the remaining useful life is reduced with the reliability and rotational cycle. Therefore, it is reasonable to conclude that the degradation process follows a linear relationship that can be easily predicted.
Figure 7.
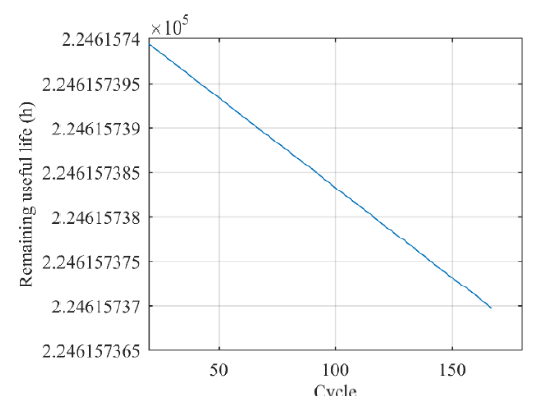
Figure 7.
Expectation of the remaining useful life prediction of point 5 with n=1000
Figure 8.
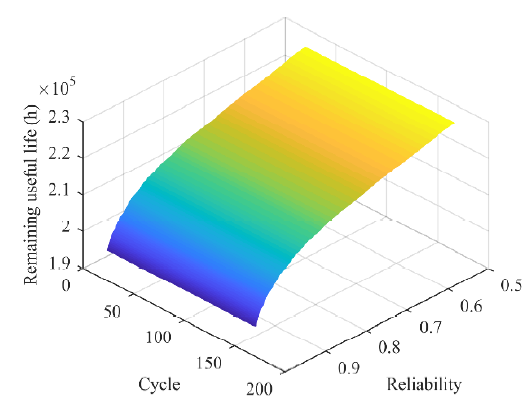
Figure 8.
Relation between rotational cycle, reliability, and remaining useful life of point 5 with n=1000
Figure 9 shows the contact stress of the gear system at each point whenn=2000, wherein the horizontal axis represents the number of rotations of gear 1. Obviously, the contact state of the gears is unstable because the gear separation phenomenon can be observed intermittently since the contact stress is sometimes equal to zero. At this rotational speed, the mean contact stress of point 5 is relatively small, about 50MPa. However, the adjacent point has the highest value and can reach more than 100MPa. The mean contact stress values of other points are relatively close.
Figure 9.
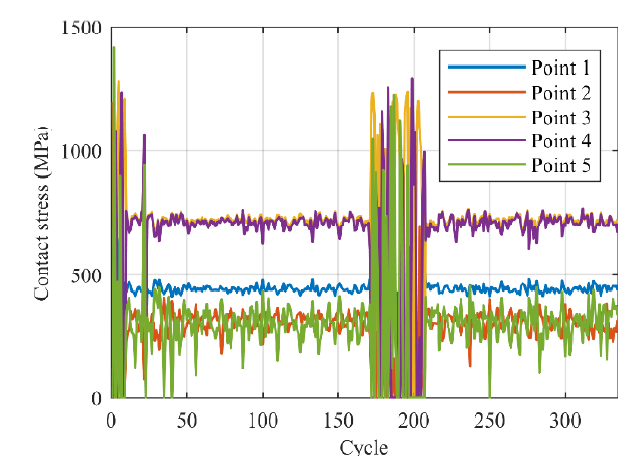
Figure 9.
Contact stress for five points with n=2000
Figure 10 and Figure 11 illustrate the degradation process of the gear system with n=2000. Unlike the degradation process shown in Figure 7, the lifetime of gear contact fatigue under this condition is about 9.15×10³ h and the gear system followsa non-linear and discontinuous degradation process at higher rotational speeds. There are also obvious oscillations because of the gear separation phenomenon. Moreover, fluctuations can be observed as the reliability increases, as shown in Figure 11. The figure also shows that the remaining useful life decreases with reliability. Based on the characteristics of the gear degradation model, it is necessary to combine the fatigue assessment with the dynamic analysis, since the gears display a strong non-linear behavior.
Figure 10.
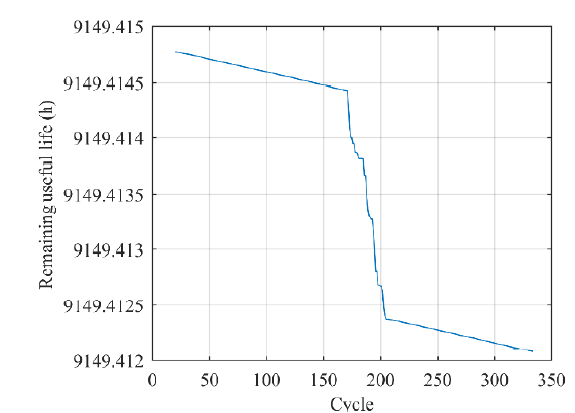
Figure 10.
Expectation of the remaining useful life prediction of point 3 with n=2000
Figure 11.
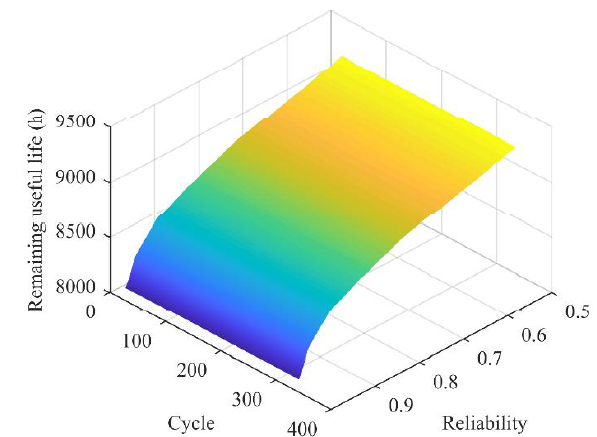
Figure 11.
Relation between rotational cycle, reliability, and remaining useful life of point 3 with n=2000
Figure 12 shows the contact stress of the gear system at each point whenn=3000, wherein the horizontal axis represents the number of rotations of gear 1. As a whole, the contact state of the gears at this rotational speed is relatively stable and is driving side contact. Point 3 has a highest mean value, which reaches nearly 140MPa. The mean contact stress of point 5 and point 4 have a similar level, about 100MPa. Point 1 and point 2 have a lower mean contact stress level.
Figure 12.
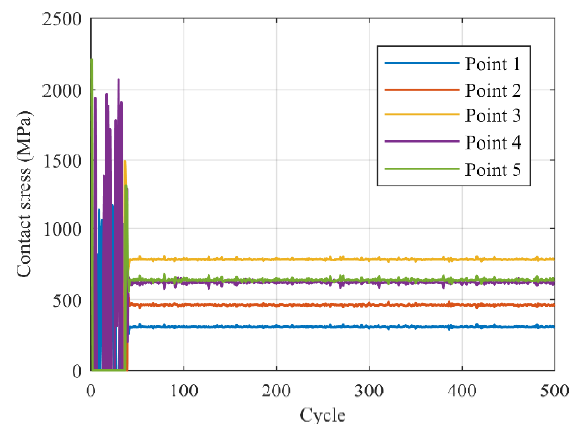
Figure 12.
Contact stress for five points with n=3000
Figure 13 and Figure 14 illustrate the degradation process of the gear system with n=3000. The total lifetime of the gear teeth is about 9.47×10³ h in Figure 13, which is higher than the lifetime of the teeth with n=2000 and lower than the gear teeth with n=1000. Obviously, the contact fatigue of gears follows a non-linear relationship with the rotational speed of gears, rather than increasing or decreasing monotonically with an increase in the rotational speed. It can be seen from Figure 13that the degradation process has a linear relation and the lifetime decreases smoothly. Figure 14 shows that the remaining useful life is reduced with the reliability and rotational cycle. Therefore, it is reasonable to conclude that the degradation process followsa linear relationship that can be predicted easily.
Figure 13.
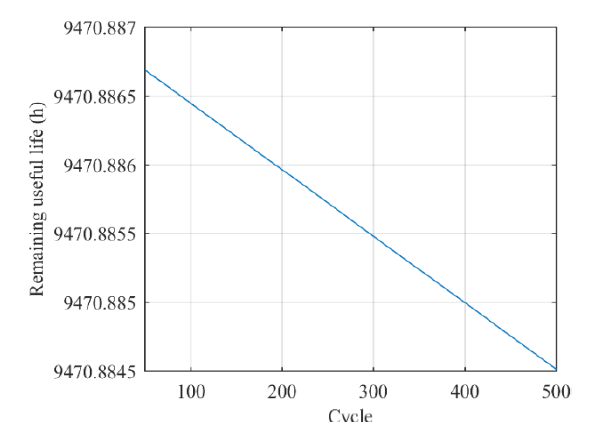
Figure 13.
Expectation of the remaining useful life prediction of point 3 with n=3000
Figure 14.
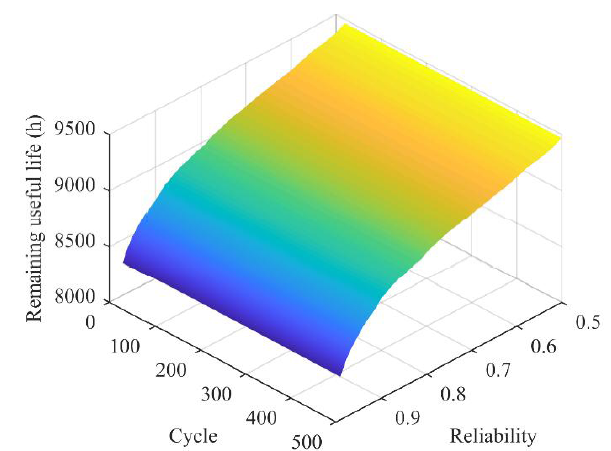
Figure 14.
Relation between rotational cycle, reliability, and remaining useful life of point 3 with n=3000
5. Conclusions
This paper focuses on the degradation process of gear systems on contact damage and the reliability assessment of the lifetime of gear surfaces. The main conclusions are given as follows:
A contact damage-torsional vibration coupling dynamic model of the gear system is proposed to evaluate the remaining useful life. It can clearly reflect the different contact behavior caused by the gear separating phenomenon and torsional vibration during the rotation of gears. Therefore, it is reasonable to establish the coupling model to analyze the degradation process.
Gear contact fatigue is nonlinear and disordered behavior. Due to the phenomenon of gear separation, the prediction of the remaining useful life of gear teeth is very difficult without the combination of dynamic studies. The contact stress of gears varies with the tooth profile, so the more gear contact points that are analyzed, the more accurate the results of the contact fatigue evaluation. The degradation process should be considered under different rotational speeds and external excitations.
Based on the contact damage-torsional vibration coupling dynamic model, we plan to investigate more degradation processes of gear systems, including crack, wear, etc. Moreover, the dynamic analysis should be performed under different working conditions.
Acknowledgements
This paper was supported by the National Key Research and Development Program (No. 2016YFB1200402).
Reference
“Condition Monitoring and Remaining Useful Life Prediction using Degradation Signals: Revisited, ”
DOI:10.1080/0740817X.2012.706376
URL
[Cited within: 1]

Condition monitoring is an important prognostic tool to determine the current operation status of a system/device and to estimate the distribution of the remaining useful life. This article proposes a two-phase model to characterize the degradation process of rotational bearings. A Bayesian framework is used to integrate historical data with up-to-date in situ observations of new working units to improve the degradation modeling and prediction. A new approach is developed to compute the distribution of the remaining useful life based on the degradation signals, which is more accurate compared with methods reported in the literature. Finally, extensive numerical results demonstrate that the proposed framework is effective and efficient.
“An Intelligent Prognostic System for Gear Performance Degradation Assessment and Remaining Useful Life Estimation, ”
“Using Multi-Scale Entropy and Principal Component Analysis to Monitor Gears Degradation via the Motor Current Signature Analysis, ”
DOI:10.1016/j.ymssp.2016.12.027
URL
[Cited within: 1]

This paper describes an approach for identifying localized gear tooth defects, such as pitting, using phase currents measured from an induction machine driving the gearbox. A new tool of anomaly detection based on multi-scale entropy (MSE) algorithm SampEn which allows correlations in signals to be identified over multiple time scales. The motor current signature analysis (MCSA) in conjunction with principal component analysis (PCA) and the comparison of observed values with those predicted from a model built using nominally healthy data. The Simulation results show that the proposed method is able to detect gear tooth pitting in current signals.
“Early Diagnostic of Concurrent Gear Degradation Processes Progressing under Time-Varying Loads, ”
DOI:10.1016/j.ymssp.2016.01.017
URL
[Cited within: 1]
61Detection of multi and concurrent defaults developing under time-varying loads.61The approach founds its detection strategy on a descriptor evolution tracking.61A scaling factor eliminates the load fluctuation repercussions on signature signals.61The procedure promptly detects the presence of evolving abnormal phenomena.61The descriptor evinces strong perturbations at tooth fracture positions.
“A Critical Study of Different Dimensionality Reduction Methods for Gear Crack Degradation Assessment under Different Operating Conditions, ”
DOI:10.1016/j.measurement.2015.09.032
URL
[Cited within: 1]
Gear cracks are some of the most common faults found in industrial machinery. Identification of different gear crack levels is beneficial to assessing gear crack degradation and preventing any unexpected machine breakdowns. In this paper, redundant statistical features are extracted from binary wavelet packet transform at different decomposition levels to describe different gear crack levels. Because the dimensionality of the extracted redundant statistical parameters is high to 620, it is necessary to reduce their dimensionality prior to the use of any statistical model for intelligently identifying different gear crack levels. The major idea of dimensionality reduction is that the extracted redundant statistical features in a high-dimensional space are mapped to a few significant features in a low-dimensional space, where these significant features are used to represent different gear crack levels. As of today, there are many popular linear and non-linear dimensionality reduction methods including principal component analysis, kernel principal components analysis, Isomap, Laplacian Eigenmaps and local linear embedding. Different dimensionality reduction methods have different performances in dimensionality reduction, which can be measured by prediction accuracies of some common statistical models, such as Naive Bayes classifier, linear discriminant analysis, quadratic discriminant analysis, and classification and regression tree. Gear crack level degradation data collected from a machine in a laboratory under different operating conditions including four different motor speeds and three different loads are used to investigate performances of the linear and non-linear dimensionality reduction methods. In our case study, the results show that principal component analysis has the best performance in dimensionality reduction and it results in the highest prediction accuracies in all of the aforementioned statistical models. In other words, the linear dimensionality reduction method is better than all of the non-linear dimensionality reduction methods investigated in this paper.
“Prognostics and Health Management: A Review of Vibration based Bearing and Gear Health Indicators, ”
DOI:10.1109/access.2017.2774261 URL [Cited within: 1]
“Uncertainty Quantification in Gear Remaining Useful Life Prediction Through an Integrated Prognostics Method, ”
DOI:10.1109/TR.2013.2241216
URL
[Cited within: 1]
Accurate health prognosis is critical for ensuring equipment reliability and reducing the overall life-cycle costs. The existing gear prognosis methods are primarily either model-based or data-driven. In this paper, an integrated prognostics method is developed for gear remaining life prediction, which utilizes both gear physical models and real-time condition monitoring data. The general prognosis framework for gears is proposed. The developed physical models include a gear finite element model for gear stress analysis, a gear dynamics model for dynamic load calculation, and a damage propagation model described using Paris' law. A gear mesh stiffness computation method is developed based on the gear system potential energy, which results in more realistic curved crack propagation paths. Material uncertainty and model uncertainty are considered to account for the differences among different specific units that affect the damage propagation path. A Bayesian method is used to fuse the collected condition monitoring data to update the distributions of the uncertainty factors for the current specific unit being monitored, and to achieve the updated remaining useful life prediction. An example is used to demonstrate the effectiveness of the proposed method.
“Global Bifurcation and Chaos Analysis in Nonlinear Vibration of Spur Gear Systems, ”
DOI:10.1007/s11071-013-1104-4
URL
[Cited within: 1]
The global homoclinic bifurcation and transition to chaotic behavior of a nonlinear gear system are studied by means of Melnikov analytical analysis. It is also an effective approach to analyze homoclinic bifurcation and detect chaotic behavior. A generalized nonlinear time varying (NLTV) dynamic model of a spur gear pair is formulated, where the backlash, time varying stiffness, external excitation, and static transmission error are included. From Melnikov method, the threshold values of the control parameter for the occurrence of homoclinic bifurcation and onset of chaos are predicted. Additionally, the numerical bifurcation analysis and numerical simulation of the system including bifurcation diagrams, phase plane portraits, time histories, power spectras, and Poincare sections are used to confirm the analytical predictions and show the transition to chaos.
“Quasi-Static Analysis of the Nonlinear Behavior of a Railway Vehicle Gear System Considering Time-Varying and Stochastic Excitation, ”
DOI:10.1007/s11071-018-4204-3
URL
[Cited within: 1]
The gearboxes of machines generally operate under a time-varying state rather than under steady-state conditions. However, it is difficult to investigate the nonlinear dynamics of a time-varying gear...
“Vibration Feature Evolution of Locomotive with Tooth Root Crack Propagation of Gear Transmission System, ”
“Dynamic Modeling of Gearbox Faults: A Review, ”
DOI:10.1016/j.ymssp.2017.05.024
URL
[Cited within: 1]
Gearbox is widely used in industrial and military applications. Due to high service load, harsh operating conditions or inevitable fatigue, faults may develop in gears. If the gear faults cannot be detected early, the health will continue to degrade, perhaps causing heavy economic loss or even catastrophe. Early fault detection and diagnosis allows properly scheduled shutdowns to prevent catastrophic failure and consequently result in a safer operation and higher cost reduction. Recently, many studies have been done to develop gearbox dynamic models with faults aiming to understand gear fault generation mechanism and then develop effective fault detection and diagnosis methods. This paper focuses on dynamics based gearbox fault modeling, detection and diagnosis. State-of-art and challenges are reviewed and discussed. This detailed literature review limits research results to the following fundamental yet key aspects: gear mesh stiffness evaluation, gearbox damage modeling and fault diagnosis techniques, gearbox transmission path modeling and method validation. In the end, a summary and some research prospects are presented.
“Coupled Multi-DOF Dynamic Contact Analysis Model for the Simulation of Intermittent Gear Tooth Contacts, Impacts and Rattling Considering Backlash and Variable Torque, ”
“Dynamic Simulation for System Response of Gearbox including Localized Gear Faults
, ”
“Hertzian Damping, Tooth Friction and Bending Elasticity in Gear Impact Dynamics, ”
