


1. Introduction
Energy crisis and environmental concerns are urgent problems that need to be solved forthe world’s sustainable development [1-3]. Lithium-ion batteries are regarded as the most promising energy candidate, owing to their high energy density, long cycle life, and low self-discharge, and they have been widely employed in hybrid electric vehicles (HEVs), smart grids, and aircraft energy storage systems [4]. With the increase in market demand, high safety and reliability have become the basic requirements for lithium-ion batteries [5]. The battery management system (BMS) is a fundamental element to make battery operation safe, reliable, and efficient [6-7]. The two key tasks in BMS are to estimate SOH and predict RUL to avoid battery abuse and prolong its life span [8-10]. Some studies show that the internal resistance can be the SOH indicator [11], and some researchers have advocated for other indicators, such as the diffusion capacitance [12].
Most researchers have estimated SOH or predicted RUL of lithium-ion batteries with a single feature (capacity or internal resistance). Although this method is used extensively, the resultsare inaccurate because there are many factors that affect SOH or RUL. RVM is employed with the input of CCCT and AT for on-board capacity estimation of lithium-ion batteries [13]. Nick pointed out that constant CCCT and constant voltage charging time (CVCT) impacted the SOH, and four features were fused to obtain an integrated SOH [14-15]. It was found that constant CCCT and the capacity have a strong linear correlation when the capacity is more than 80% of its rated value, during which the battery is considered healthy. Thus, this paper employs CCCT as the SOH indicator. In this paper, a newly integrated SOH indicator is developed with the help of the beta distribution function from the point of view of capacity and power requirements. We compare the results of SOH integration of different features (including fusion of two features and fusion of three features).
SOH is an integration measure reflecting the current status of a battery in comparison with its fresh status [16]. Lithium-ion battery degradation occurs mainly in properties of the battery, and a loss of lithium-ions will lead to the decline in capacity and the rise in impedance [17]. An increase in internal resistance will be accompanied by a decline in energy density, voltage, and power [18]. The fundamental reason for capacity fade is the failure of the material, and it is closely connected with objective factors such as the battery manufacturing process and the use environment [19]. From the material point of view, the reduction of battery capacity is mainly due to the structure of the cathode material, the SEI transition growth of the negative surface, electrolyte decomposition, metamorphism, collector fluid corrosion, and so on [20]. The capability of power output is determined by both the capacity and the internal resistance. In the process of using the lithium-ion battery, the internal resistance has different changes with the state of charge/discharge (SOC), working environment, life assessment, and state of health (SOH) estimates [20]. Synchrotron radiation technology is the potential lag and voltage decay factor [21]. The fundamental material anomalies are the fundamental factors that increase the internal resistance and battery polarization. Therefore, only using a single feature, such as capacity or internal resistance, to estimate the SOH of the battery is incomprehensive [14]. SOH estimation based on CVCT or CCCT is inaccurate without compensation for discharge depth. So far, many researchers have studied SOH estimation using capacity or internal resistance separately. In order to study the problem of the degree of influence of different indicators, in this paper, we used the beta distribution function to fuse multiple features, considered the changes of the SOH of the battery, and then compared the results of SOH integration of different features (including the fusion of two features and fusion of three features).
The rest of this paper is organized as follows:Section 2 introduces battery experiments, including the charge-discharge process and the identification of the integrated SOH indicator. Section 3 conducts the calculation method of SOH for various features and the process of integrating with SOH of distinctive features and result analysis. Finally, some conclusions are given in Section 4.
2. Experiments
2.1. Charge/Discharge Process
Each of the three batteries are divided into two types, including 1.1Ah lithium-ion batteries of CS2 type and 1.35Ah lithium-ion batteries of CX2 type. LiCoO2 mixed with carbon of CS2 type as a conductive additive was used as the cathode, while layered graphite bound together with polypropylene fluoride was used as the anode. LiCoO2 mixed with carbon CX2 type as a conductive additive was used as the cathode, while layered graphite bound together with polypropylene fluoride was used as the anode. Different charge/discharge profiles were used for cycle life testing, as shown inTable 1.
Table 1. Charge/discharge profiles
| Battery | Charge profile | Discharge profile |
|---|---|---|
| CS2-33 Constant current rate of 0.5C | Constant current charge at 0.55A from 3.8V to 4.2V, constant voltage charge at 4.2V from 1.1A to 0.05A. | Constant current discharge at 1.1A from 4.2V to 2.7V |
| CS2-38Constant current rate of 1.0C | Constant current charge at 0.55A from 3.8V to 4.2V, constant voltage charge at 4.2V from 1.1A to 0.05A. | Constant current discharge at 0.55A from 4.2V to 2.7V |
| CX2-34Constant current rate of 1.0C | Constant current charge at 0.675A from 3.6V to 4.2V, constant voltage charge at 4.2V from 1.16A to 0.05A. | Constant current discharge at 1.35A from 4.2V to 2.7V |
The charge/discharge profile of battery CS2 is shown in Figure 1 and consists of three phases. The first stage is the constant current charging phase. In Figure 1(a), we can see that the constant charging time of the battery gradually decreased with the increasing charge/discharge cycles, but in Figure 1(b), the trend of voltage growth increases, indicating that the extent of battery aging increasesas the charge/discharge cycles increase. The second stage is the constant voltage charging stage. The voltage is maintained near the specific value set in the experiment, so the performance is a straight line in Figure 1(b). This is because the charging capacity of the battery increases continuously and the voltage is relatively high, which makes the charging current decrease continuously. From Figure 1(a), the amplitude change trend of the current decreases relatively slowly as the charge/discharge time increases.Due to the increase in the charge/discharge time, the internal resistance increases and the battery ages. The third stage is the unvarying current discharge stage. As shown in Figure 1(a), as the battery charging/discharging time increases, the battery ages gradually, but the trend of voltage decrease is more intense.
Figure 1.
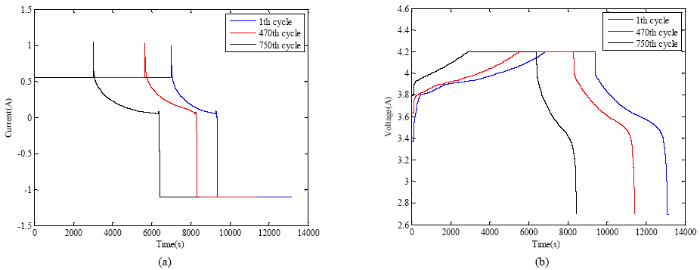
Figure 1.
(a) Current over time features; (b) Voltage over time features
2.2. Measurement Data
Figure 2 shows each feature versus cycle for CS2-33, CS2-38, and CX2-34. From the figure, the trends of capacity and CCCT are almost the same, both of which show exponential decay. However, the change of internal resistance is significantly different. For CS2 type batteries, the internal resistance is inclined to increase as the number of cycles increases. For CX2 type batteries, the internal resistance slowly decays as the number of cycles increases.
Figure 2.
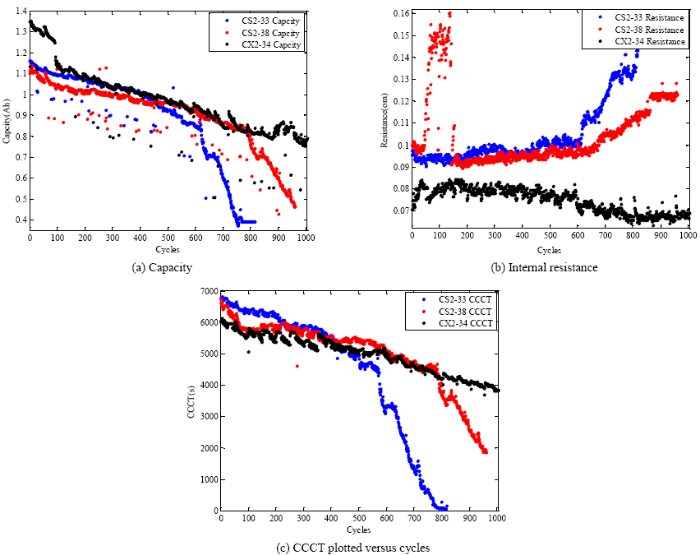
Figure 2.
Each feature
However, when the number of cycles is on the brink of 100, the internal resistance of CX2-38 increases sharply and then drops sharply. The main factors achieving the internal resistance of lithium-ion batteries are divided into battery-critical materials and battery usage environment. From Figure 2, the biggest factor should be the battery usage environment, such as temperature and humidity.
3. The Integration of SOH of Different Features
3.1. SOH Integrated Process
The capacity and CCCT generally increased with the number of cycles, so the formula for CCCT’s SOH is consistent with capacity. Currently, capacity is widely used in the field to describe the SOH of lithium-ion batteries, and it can be described as follows:
Where $Capacity(0)$ denotes the initial capacity of lithium-ion batteries (Ah), $Capacity(k)$ denotes the actual capacity of lithium-ion batteries (Ah),$Time(0)$ denotes the initial time of lithium-ion batteries (s), and $Time(k)$ denotes the actual time of lithium-ion batteries (s).Some researchers proposed the SOH definition based on internal resistance, as follows:
Where ${{R}_{new}}(0)$ denotes the internal resistance of lithium-ion battery($\Omega $), ${{R}_{eol}}$ denotes the internal resistance at the end of life($\Omega $), and $R(k)$ denotes the internal resistance in the current state($\Omega $).
In the beta distribution, parameters can be understood as pseudo count and have the same form as the beta; therefore, beta distribution can be used as a prior distribution. The mathematical form of the probability density distribution function of beta distribution is
Where $0<x<1,\text{ }\alpha >0,\text{ }\beta >0$, the variable x can only appear between 0 and 1, and $\alpha $ and $\beta $ are two parameters greater than0. $B(\alpha ,\beta )=\int_{0}^{1}{{{\mu }^{\alpha -1}}{{(1-\mu )}^{\beta -1}}\text{d}}\mu .$
The beta function was employed to incorporate capacity, internal resistance, and CCCT features. The probability density function (PDF) for the battery SOHfusat cycle k is
Where SOHfus k is the battery SOHfus at cycle k andαk and βk are parameters. The estimates of parameters αk and βk are
Where dj, k, (j=1, 2, …,n) are observations of features at cycle k, n indicates the number of features , j indicates different features, wj,k is the weight of feature dj,k, and the initial weights wj,1 =1/3 when k=1.
The point estimate of SOH at cycle k is computed by the maximum likelihood of fk(SOHfus k; αk,βk), as follows:
When the observations of the features of the next cycle (k+1) are obtained, the weights are then updated based on the following Equation[11]:
3.2. Results and Discussion
Figures 3, 4, and5 show the features and corresponding SOH. The trend for each feature is different, and the capacity and CCCT show a heavy dependence on the depth of discharge, which would be attributed to increased model complexity and constant recalibration. However, since the linear trend of each feature change is uniform across all batteries, relying solely on a single feature to judge SOH estimation may result in inaccurate estimation of SOH.
Figure 3.
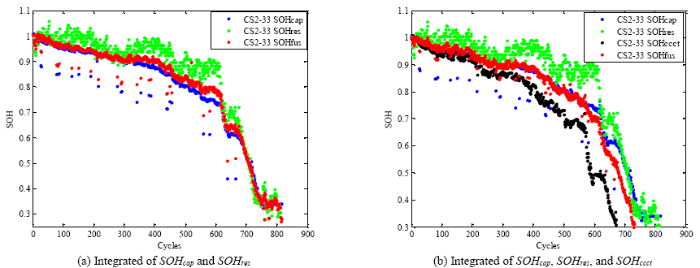
Figure 3.
Integration of SOH of different features for battery CS2-33
Figure 4.
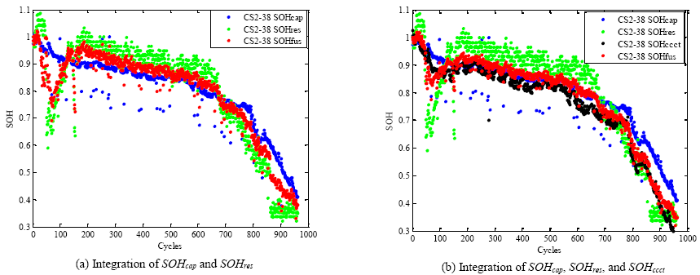
Figure 4.
Integration of SOH of different features for battery CS2-38
Figure 5.
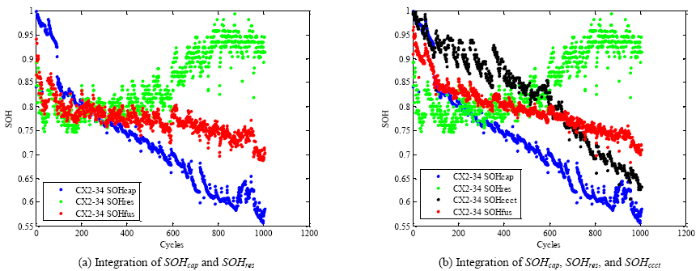
Figure 5.
Integration of SOH of different features for battery CS2-34
3.2.1. The Integration of the Same Battery with Different SOH
In Figures 3 and 4, (a) is the value of SOHcap and SOHres integration, where the integrated SOHfus value is exactly the average of the two, and (b) is the SOHcap, SOHres, and SOHccct values after integration, and the distribution of theSOHfus values fluctuates between these three eigenvalues. From Figures 3 and 4, the constant current rate of the battery is different. TheSOHcap and SOHccct decay rate or SOHres growth rate is also different. The internal resistance measurements for battery CS2-33 are highly favorable, even more so than in the simplest test conditions shown in battery CS2-38. The internal resistance increases linearly throughout the entire cycle life with less noise than what was found in batteries CS2-38. In addition, for the batteries, which are the same type, the charge/discharge rates and discharge currents will also lead to different SOH and RUL.
According to GB / T31484-2015, in the standard cycle life of “standard cycle life test, the number of cycles up to 500 times the capacity should not be less than 90% of the initial capacity, or the number of cycles up to 1000 times the capacity should not below 80% of the initial capacity”. If the capacity drops sharply within the universal cycle, this is a failure of capacity fade. Since the battery capacity is only currently used to determine the battery failure criteria, and other features do not give the failure criteria, SOHfus and SOHcap can only be reported to analyze the accuracy of the integrated results. From Figure 3(a),if the battery failure time is established according to the above criteria and the number of cycles reaches 294, the SOHcap will start to be lower than 90% of the original SOHcapand the batteryis judged as invalid. If the same criterion is used, the SOHfus and SOHcap have some margin of error to determine the failure criteria. When the number of cycles reaches 290, the SOHfus starts to be lower than 90% of the initial SOHfus and the battery is considered failed. Compared with Figure 3(a), Figure 3(b) is the SOHfus integration of the three features SOHfus. When the number of cycles reaches 249, SOHfus will start to be lower than 90% of the initial SOHfus, and the battery is judged as failed. It can be observed that the SOH integration of the three features is better than the SOH integration of the two features.
Due to the different charging/discharging rates, the trend of each feature in Figures 3 and 4 is also different. From Figure 4, if the battery capacity is used to determine the battery failure time, the CS2-38 battery failure time is 125 times the number of cycles. Judging from the integrated point of view, the CS2-38 battery fails when the number of cycles reaches about 100 times. This requires further analysis of the failure mechanism of the battery. In the process of using lithium-ion batteries, because the internal resistance will vary with the state of charge/discharge (SOC) and environment, the cycle times will be different and impact the battery performance testing, life assessments, and state of health (SOH) estimates.
3.2.2. The Integration of Different Batterieswith Different SOH
Figures 3 and 5 are two different types of battery features of different values of SOH trend.The biggest difference is the trend of internal resistance: for CS2 type batteries, the charging internal resistance increases, while for CX2 type batteries, the charging internal resistance gradually decreases. The fluctuation of the decrease or increase tendency is not large, resulting in the change law. The reason for this is not yet known and requires further study. However, with the trend of this internal resistance change, the traditional ones where the internal resistance increases gradually with the increase in the number of charges/discharges are one-sided. In addition, the CCCT changes of the two types of batteries are also different. For CS2 type batteries, if the CCCT failure threshold is the same as the capacity failure threshold, noted as 90%, the CCCT first reaches the failure threshold as shown in Figure 5(b). For CX2 type batteries, the result is the opposite and the capacity first reach the failure threshold.
4. Conclusions
Observations of the capacity, resistance, and CCCT were extracted from battery cycling experiments, and the variations of these three features were correlated to aging mechanisms. We conclude that the capacity, resistance, and CCCT should be integrated to produce a new SOH indicator from the point of view of capacitance and power. Consequently, a method to integrate this new SOH indicator is developed using the beta function.
In this paper, SOH with different characteristics is fused with the beta function, and fused SOH (including a single feature SOH, two features SOH, and three features SOH) are compared to obtain a comprehensive SOH that will be greatly improved for battery reliability evaluation and BMS systems. This approach also avoids the one-sidedness caused by SOH evaluation of a single feature.
In addition, many researchers often use the internal resistance to evaluate the battery SOH, but for some batteries, the external factors or internal factors have a greater impact on the battery and battery SOH evaluation or RUL of the prediction will be affected, so the use of internal resistance to evaluate the battery SOH or predict the battery RUL has some difficulties.
In this article, only SOH is analyzed and compared. Future works could focus on building a better model for SOH estimation that considers the capacity, internal resistance, and CCCT combined with other identification algorithms. Furthermore, the works could aim to perfectly obtain the capacity, internal resistance, and CCCT characteristics using experimental data at different temperatures.
Acknowledgements
This research was sponsored by the Natural Science Foundation of Heilongjiang Province (No. QC2016068), University Nursing Program for Young Scholars with Creative Talents in Heilongjiang Province (No. UNPYSCT-2017087), and Heilongjiang Provincial Department of Education Research Project (No. HPDERP-12531097). The authors thank CALCE for providing the testing data of batteries.
Reference
“A Blueprint for an Energy Policy in Greece with Considerations of Climate Change, ”
“Effective and Persistent Changes in Household Energy-Saving Behaviors: Evidence from Post-Tsunami Japan, ”
“Experimental Study on the Self Humidification Effect in Proton Exchange Membrane Fuel Cells Containing Double Gas Diffusion Backing Layer, ”
DOI:10.1016/j.apenergy.2015.02.027
URL
[Cited within: 1]

Adequate hydration of the membrane is required to ensure high proton conductivity in proton exchange membrane fuel cells (PEMFCs), which, in turn, is required for achieving high cell performances. While external humidifiers are typically used to humidify the supplied air in conventional systems, their use increases the complexity, weight, volume, and parasitic power loss in fuel cell systems, rendering them unviable in some systems, particularly for portable applications. In this study, the structure of a gas diffusion backing layer (GDBL) was modified to enhance the self-humidification effect in PEMFCs. Three types of GDLs were prepared for the experiments: a conventional GDL (GDL-A with uniform single GDBL) and two modified GDLs (GDL-A with uniform double GDBL and GDL-A with heterogeneous double GDBLs). In order to evaluate the effect of stacking and structural design on the self-humidification characteristics, some characteristics of the GDLs such as contact angle, resistance, and vapor permeation rate were measured. The electrochemical performances of the fuel cells were also measured at various relative humidity (RH) and stoichiometric ratio (SR) conditions. The results showed that stacking had a negligible effect, where as the structural design of the GDBL had a significant effect on self-humidification. The self-humidification effect and the cell performance were improved significantly in the structurally modified GDBL. In addition, considering the actual field conditions and the results of the present study, it was concluded that the structural modifications made to the GDBL would be beneficial in improving the performance of the self-humidified PEMFCs.
“Capacity Fade Modelling of Lithium-Ion Battery under Cyclic Loading Conditions, ”
“A Review on the Key Issues for Lithium-Ion Battery Management in Electric Vehicles, ”
DOI:10.1016/j.jpowsour.2012.10.060
URL
[Cited within: 1]
Compared with other commonly used batteries, lithium-ion batteries are featured by high energy density, high power density, long service life and environmental friendliness and thus have found wide application in the area of consumer electronics. However, lithium-ion batteries for vehicles have high capacity and large serial-parallel numbers, which, coupled with such problems as safety, durability, uniformity and cost, imposes limitations on the wide application of lithium-ion batteries in the vehicle. The narrow area in which lithium-ion batteries operate with safety and reliability necessitates the effective control and management of battery management system. This present paper, through the analysis of literature and in combination with our practical experience, gives a brief introduction to the composition of the battery management system (BMS) and its key issues such as battery cell voltage measurement, battery states estimation, battery uniformity and equalization, battery fault diagnosis and so on, in the hope of providing some inspirations to the design and research of the battery management system.
“A Novel Approach of Remaining Discharge Energy Prediction for Large Format Lithium-Ion Battery Pack, ”
DOI:10.1016/j.jpowsour.2017.01.054
URL
[Cited within: 1]
61Remaining discharge energy is initiated for battery pack.61Temperature is taken into consideration in battery pack model description.61Battery inconsistency is considered to analyze the battery usage efficiency.61The accuracy and robustness of the method is verified by dynamic profiles.
“Critical Review of State of Health Estimation Methods of Li-Ion Batteries for Real Applications, ”
DOI:10.1016/j.rser.2015.11.042
URL
[Cited within: 1]
61Comprehensive and extensive review of State of Health estimation methods for real applications.61Consideration of requirements on battery monitoring algorithms is included.61Strengths and weaknesses of the methods are elaborated based on requirements and accuracy.
“Realistic Lifetime Prediction Approach for Li-Ion Batteries, ”
DOI:10.1016/j.apenergy.2015.10.115
URL
Highlights 61 Cost-effective methodology for reliable lifetime estimation. 61 Novel and systematic validation protocol for ageing models. 61 Combination of calendar and cycle ageing. 61 Degradation under different realistic dynamic operating conditions. 61 Easy integration of measured parameters into diagnostic tools. Abstract A novel methodology for lifetime prognosis of Li-ion cells is presented, covering the validity and accuracy assessment of the predictions. It is especially focused on the procedures for the evaluation of semi-empirical ageing model development process. Combined calendar and cycle ageing is investigated with dynamic and realistic complex operation profiles, as part of the stepwise validation methodology that is proposed. The dynamic validation approach allows identifying the sources of model errors by analysing how the individual stress factors are adjusted under non-constant profiles. The results correspond to a LFP-based 26650-size cell. The presented model is suitable for different applications, such as elevator or vehicle combined with vehicle-to-grid (V2G) use, with 1.4% root-mean-square error accuracy.
“An Online Method for Lithium-Ion Battery Remaining Useful Life Estimation using Importance Sampling and Neural Networks, ”
DOI:10.1016/j.apenergy.2016.04.057
URL
[Cited within: 1]
An accurate battery remaining useful life (RUL) estimation can facilitate the design of a reliable battery system as well as the safety and reliability of actual operation. A reasonable definition and an effective prediction algorithm are indispensable for the achievement of an accurate RUL estimation result. In this paper, the analysis of battery terminal voltage curves under different cycle numbers during charge process is utilized for RUL definition. Moreover, the relationship between RUL and charge curve is simulated by feed forward neural network (FFNN) for its simplicity and effectiveness. Considering the nonlinearity of lithium-ion charge curve, importance sampling (IS) is employed for FFNN input selection. Based on these results, an online approach using FFNN and IS is presented to estimate lithium-ion battery RUL in this paper. Experiments and numerical comparisons are conducted to validate the proposed method. The results show that the FFNN with IS is an accurate estimation method for actual operation.
“Online Identification of Lithium-Ion Battery Parameters based on an Improved Equivalent Circuit Model and its Implementation on Battery State-of-Power Prediction, ”
“Determination of Lithium-Ion Battery State-of-Health based on Constant-Voltage Charge Phase, ”
DOI:10.1016/j.jpowsour.2014.02.020
URL
[Cited within: 1]
61Experiments on calendar aging of four lithium battery technologies.61Constant voltage (CV) charge phase data helped to determine battery state of health.61According to technology, CV current and/or CV duration through aging are exploited.61A simple method that can be easily implemented in a BMS.
“Online Capacity Estimation of Lithium-Ion Batteries based on Novel Feature Extraction and Adaptive Multi-Kernel Relevance Vector Machine, ”
DOI:10.3390/en81112320
URL
[Cited within: 1]
Prognostics is necessary to ensure the reliability and safety of lithium-ion batteries for hybrid electric vehicles or satellites. This process can be achieved by capacity estimation, which is a direct fading indicator for assessing the state of health of a battery. However, the capacity of a lithium-ion battery onboard is difficult to monitor. This paper presents a data-driven approach for online capacity estimation. First, six novel features are extracted from cyclic charge/discharge cycles and used as indirect health indicators. An adaptive multi-kernel relevance machine (MKRVM) based on accelerated particle swarm optimization algorithm is used to determine the optimal parameters of MKRVM and characterize the relationship between extracted features and battery capacity. The overall estimation process comprises offline and online stages. A supervised learning step in the offline stage is established for model verification to ensure the generalizability of MKRVM for online application. Cross-validation is further conducted to validate the performance of the proposed model. Experiment and comparison results show the effectiveness, accuracy, efficiency, and robustness of the proposed approach for online capacity estimation of lithium-ion batteries.
“Comparative Analysis of Features for Determining State of Health in Lithium-Ion Batteries, ”
“On-Board Capacity Estimation of Lithium-Ion Batteries based on Charge Phase, ”
“State-of-Charge and State-of-Health Lithium-ion Batteries Diagnosis According to Surface Temperature Variation, ”
DOI:10.1109/TIE.2015.2509916
URL
[Cited within: 1]
This paper presents a hybrid state-of-charge (SOC) and state-of-health (SOH) estimation technique for lithium-ion batteries according to surface temperature variation (STV). The hybrid approach uses an adaptive observer to estimate the SOH while an extended Kalman filter (EKF) is used to predict the SOC. Unlike other estimation methods, the closed-loop estimation strategy takes into account the STV and its stability is guaranteed by Lyapunov direct method. In order to validate the proposed method, experiments have been carried out under different operating temperature conditions and various discharge currents. Results highlight the effectiveness of the approach in estimating SOC and SOH for different aging conditions.
“Theory of SEI Formation in Rechargeable Batteries: Capacity Fade, Accelerated Aging and Lifetime Prediction, ”
“Failure Analysis of Lithium-Ion Batteries, ”
“Overview of the Failure Analysis of Lithium-Ion Batteries, ”
“Causes for Capacity Decrease of Li-Ion Batteries, ”
“A Comparative Review of Prognostics based Reliability Methods for Lithium Batteries, ”
in
DOI:10.1109/PHM.2011.5939585
URL
[Cited within: 1]
This paper discusses some concerned failure problems in battery reliability and investigates the latest known methodologies in health monitoring and life prediction of batteries. We conduct comparative studies on these different measurements and methods for Lithium batteries. Through combining with their respective performance, we introduce a fusion prognostic method based on Physics-of-Failure (PoF) approach in conjunction with data-driven technology. The fusion approach not only thoroughly analyses the battery failure mechanism as a result of the change of physical and chemical characteristics, it also estimates a number of parameters with the aid of real-time surveillance. Furthermore, we present the specific frameworks to implement the cell life prediction and battery inconsistency monitoring. The estimated State-of-Charge (SOC), State-of-Health (SOH), State-of-Life (SOL) and the level of the battery inconsistency will present a more accurate and competitive prediction according to the proposed approach.
