Forecasting Airport Surface Traffic Congestion based on Decision Tree
Zhang Zhaoyue , Zhang An
通讯作者:
版权声明: 2020 【-逻*辑*与-】#x000a9; 2020 Totem Publisher, Inc. All rights reserved.
展开
Abstract
To improve the operational efficiency of airport surfaces, this paper studies the air traffic congestion prediction of airport surfaces, demonstrates the limitations of traffic congestion prediction, and proposes a prediction method for airport surface traffic congestion based on decision tree. Firstly, the definition and measurement methods of traffic congestion in airport surfaces are promoted. Then, the key factors affecting traffic congestion are extracted, and a prediction model of traffic congestion is established. Finally, we verify the validity of the model based on actual operation data from Atlanta. The results show that the accuracy of the prediction is 70%.
Keywords:
© 2020 Totem Publisher, Inc. All rights reserved.
1.Introduction
With the rapid development of the air transport industry, air traffic demand has risen sharply. The traffic supply and demand contradictions are prominent, and air traffic congestion is becoming increasingly serious, especially in the case of airport surface traffic congestion. Traffic congestion often causes huge economic losses, environmental pollution (mainly air pollution and airport noise pollution), and increased controller workload, which seriously affects the safety and efficiency of air traffic operations.
To solve the problem of traffic congestion of airport surfaces, it is necessary not only to further strengthen the infrastructure construction of the air traffic control department, but also to maximize the utilization of the existing surface resources. Therefore, it is particularly important to establish an evaluation system of "airport surface traffic congestion". The airport traffic congestion evaluation system has a great impact on the actual traffic operation of the whole airport: it helps airport traffic managers operate aircraft efficiently and safely. The quantitative relationship between traffic congestion and average delay time, traffic saturation, queue length, and so on can be analyzed comprehensively. At the same time, it also helps the relevant aircraft release departments and controllers make correct and wise release decisions.
At present, the problem of air traffic congestion has been studied by many scholars. In 2009, Tao et al. analyzed the relationship between demand, capacity, and flight delays of airport surface traffic and divided the air traffic states by studying the delays of all departing aircraft [1]. In 2012, Wang Lei of Xi'an University of Technology analyzed and developed a short-term prediction model of air traffic flow based on a combination of linear regression and support vector machine. A short-term prediction system, which provides data support and decision-making basis for the relevant control departments to solve airport surface traffic congestion, was also developed [2]. In 2013, Li Shanmei of the Civil Aviation University of China carried out further research by analyzing congestion behavior. The congestion indicator system and air traffic congestion spread prediction were established [3]. The enhanced air traffic management system (Enhanced Traffic Management System, ETMS) in the United States holds that air traffic congestion occurs when air traffic demand is greater than air traffic capacity. Air traffic states are recognized based on the above rule [4]. In 2001, Chatter and Sridhar obtained that there is a nonlinear relationship between the dynamic density index and the controller's workload, and the neural network method was used to model the dynamic density [5]. In 2002, Wang and Tene et al. studied the queuing delay time of aircraft arriving and departing the airport and regarded it as a measure of airport congestion. It was pointed out that the different queuing delay time of aircraft was caused by different airport traffic demands and airport traffic capacity, and the propagation phenomenon of queuing delay time was studied [6]. In 2005, the MRTIE organization, represented by Wanke, also compared airport demand with capacity to determine airport surface traffic states [7].
Although there are some advantages of the above studies, the definition and measurement method of airport surface traffic congestion are insufficient. The definition and measurement method of traffic congestion is the basis of air traffic congestion identification and prediction. At present, there is no unified standard for the definition of traffic congestion. In the past, research on air traffic congestion mainly focused on comparing the air traffic demand and capacity. When the demand is greater than the capacity, air traffic congestion occurs. For the complex air traffic system, this definition method is obviously too simple, lacks relevant theoretical analysis and specific quantitative analysis indicators, and does not reflect the essential characteristics of traffic congestion. Moreover, it cannot reflect the dynamic process of the emergence and development of traffic congestion.
Thus, this paper explores the influencing factors of airport surface traffic congestion, establishes the airport surface traffic congestion state prediction model based on decision tree algorithm, and finally gives an example analysis. A decision tree of air traffic congestion for the Atlanta airport is established. The validity of the prediction model is verified.
2. Analysis of Traffic Congestion in Airport Surface
2.1. Definition of Airport Surface Traffic Congestion and Its Influencing Factors
Based on previous studies, we promote the definition of airport traffic congestion as an imbalance between airport traffic demand and capacity. Demand is the number of aircraft expected to pass through a taxiway or runway in a given time or space. Capacity refers to the maximum number of aircraft that can be accommodated on a taxiway or runway in a specific time or space. When the aircraft is running smoothly, the traffic demand of the airport is often less than the capacity. When the traffic demand of the airport is greater than its capacity, air traffic congestion of the airport surface occurs. Thus, the traffic congestion at the airport surface is determined by the traffic capacity of the airport and the traffic demand of the airport. When some factors change the air traffic capacity and demand of airport surface, the air traffic state of the airport surface will be changed. These factors are usually divided into human factors and environmental factors [8-9], including time period, special circumstances, airport infrastructure quality, holidays, controllers' workload, weather conditions, and traffic volume.
2.2. Measurement of Air Traffic Congestion at Airport Surface
Measures of airport surface traffic congestion status include taxi time, taxi speed, and taxi delay. Here, we use taxi time to measure the congestion state and define the traffic congestion index (
Where
We classify the traffic congestion state of the airport surface and divide it into four states: smooth, slight congestion, moderate congestion, and severe congestion. By consulting with the first line controllers and references, we propose the classification criteria of airport surface traffic congestion state.
The traffic congestion state of the airport surface is classified according to the following rules:
(1)
(2) 0.10 <
(3) 0.30 <
(4) 0.50 <
2.3. Attribute Extraction of Airport Surface Traffic Congestion
We explore air traffic congestion properties of airport surfaces by accessing relevant information, as shown in Table 1.
Table 1 Crowding attribute selection
| Attribute name | Attribute value |
|---|---|
| Weather conditions (rain, fog, snow, hail…) | 0-No impact, 1-Impact |
| Time slot | 0-Peak, 1-Low peak |
| Holiday and vacations | 0-Y, 1-N |
| Traffic volume | 0-Large, 1-Small |
| Airport infrastructure integrity | 0-Complete, 1-Incomplete |
| Ability of controllers | 0-Outstanding, 1-Average, 2-Poor |
| Aircraft size | 0-Large, 1-Small |
| Air force restrictions | 0-Yes, 1-No |
| Traffic volume in the previous period | 0-Large, 1-Small |
| Working day | 0-Yes, 1-No |
Based on the integrity of the airport infrastructure and the performance of airport taxiway and runway, the air traffic data of the airport surface is not well obtained. The influence of human factors cannot be quantified well. Thus, we extract influencing factors from environmental factors, such as weather conditions, time periods, holidays, traffic volume, and traffic volume of the previous time period. The identification method of air traffic congestion states for airport surfaces is established by these factors.
(1) Weather conditions: According to the weather data we find, the weather conditions are not clearly indicated. There is only weather delay data, so the weather attribute is affected when the weather delay is bigger than zero, and the weather attribute has no effect on air traffic when there is no weather delay.
(2) Time period: according to the statistical data and the working experience of front-line controllers, we define 8:00-11:00 in the morning and 2:30-5:00 in the afternoon as the peak period, and the rest of the time is the low peak period. The air traffic congestion often occurs in the peak periods.
(3) Holidays: These include national holidays.
(4) Traffic volume: According to the experience and the actual situation of the airport surface operation, we count the air traffic demand every 15 minutes. When the demand is equal or greater than to 10, the value of traffic volume attribute is 0. The value of traffic volume attribute is 1 when the demand is less than 10.
(5) Whether working day: Monday to Friday are working days, and Saturday and Sunday are non-working days.
3. Airport Surface Traffic Congestion Prediction based on Decision Tree Algorithm
Decision tree [10-12] is a non-parametric supervised learning method. It can summarize decision rules from a series of data with features and labels, and present these rules with the structure of tree graph to solve the problem of classification and regression.
3.1. Decision Tree C4.5 Algorithm
The decision tree C4.5 algorithm is an improved version of the decision tree ID3 algorithm. The attribute with the highest information gain rate is adopted as the criterion for selecting the branch attribute while inheriting advantages of the ID3 algorithm. The basic principle of the decision tree C4.5 algorithm is expressed as follows:
Where
Let attribute
Where
Where
The corresponding information gain value can be obtained from the expected information and the entropy value, and the information gain value obtained by branching A is obtained by the following formula:
The information gain in
Thus, the information gain rate for an attribute can be calculated as follows:
The C4.5 algorithm selects the attribute with the highest information gain ratio as the test attribute of a given set
3.2. Establishment of Congestion Prediction Model based on Decision Tree Algorithm
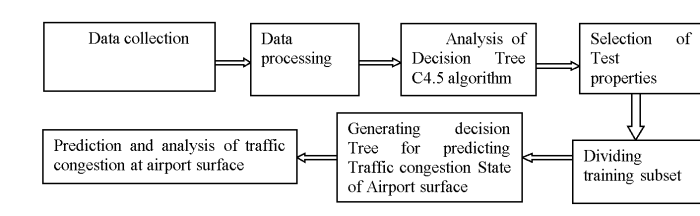
The decision tree is constructed based on the data. Before the establishment of the decision tree, we need to collect and count all kinds of required data, attributes, etc., carry on the preliminary processing to obtain the effective data, and then carry on the above process to establish the decision tree.
To sum up, the process of building a decision tree is shown in Figure 1.
4. Example Analysis
Because Atlanta Airport is one of the largest and busiest airports in the world, it is also an academic research object for many scholars and experts in the civil aviation field. Therefore, we also conduct research on the air traffic states at the Atlanta airport surface using the congestion prediction model established above.
4.1. Data Analysis and Processing
The air traffic data of the Atlanta International Airport surface from January 1, 2015 to January 7, 2015 is obtained from the US Transportation Administration website. There is a total of 308 time periods in the daytime, and every period is 15 minutes. The traffic congestion index (
Table 2 Partial calculation data
| Sample number | Weather | Time slot | Holiday or not | Traffic | Working day or not | Traffic volume in the previous period | Crowding state | |
|---|---|---|---|---|---|---|---|---|
| 1 | no influence | peak | yes | small | yes | small | 0.10 | smooth |
| 2 | no influence | peak | yes | large | yes | small | 0.17 | moderate congestion |
| 3 | no influence | peak | yes | small | yes | large | 0.10 | smooth |
| 4 | influential | peak | yes | large | no | small | 0.15 | moderate congestion |
| 5 | influential | low peak | no | large | yes | small | 0.16 | moderate congestion |
The
After further data processing statistics, the number of samples of different attribute values in each attribute is obtained, as shown in Table 3.
Table 3 Number of samples for different attribute values
| Smooth | 250 | Slight congestion | 45 | Moderate congestion | 10 | Severe congestion | 3 |
|---|---|---|---|---|---|---|---|
| no influence | 232 | influential | 57 | ||||
| peak | 154 | low peak | 154 | ||||
| holiday and vacations | 132 | non-holidays | 176 | ||||
| traffic volume | 212 | small traffic volume | 96 | ||||
| working day | 220 | non-working days | 88 | ||||
| large traffic volume in the previous period | 211 | small traffic volume in the previous period | 97 | ||||
4.2. Construction of Decision Tree
Next, the information gain rate of each attribute is calculated separately, and then the attribute with the largest information gain rate is selected as the split attribute of the decision tree.
Suppose that "whether holiday" is used as the split attribute, and the "whether holiday" attribute has two different attribute values:
When the attribute "whether holiday" is "yes",
Similarly, when "whether holiday" is "no",
According to Equation (5), the information gain is:
Based on Equation 6), we can obtain the following:
According to Equation (7), the information gain rate is calculated as follows:
In the same way, the information gain rate of other attributes can be calculated:
Then, we sort the information gain rates as follows:
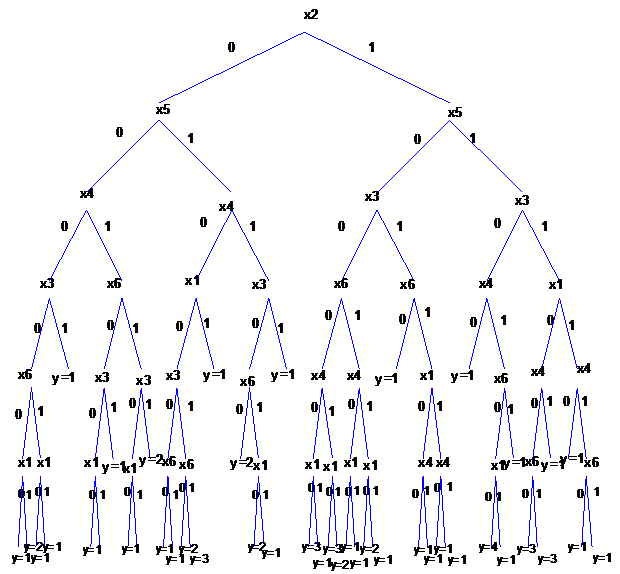
The decision tree of air traffic congestion prediction for the Atlanta International Airport surface is shown in Figure 2. It can be seen that the first split attribute is "time period", the second split attribute is "traffic volume", and so on.
Where:
According to the decision tree, the relationship between each attribute and the final traffic congestion state can be clearly obtained, for example:
When the time period = peak, whether work day = yes, weather conditions = no impact, traffic volume = large, whether holidays = yes, and traffic volume in the previous time period = large, the traffic state of the airport surface is smooth. Thus, if the air traffic managers get the values of all the attributes, they can predict the air traffic state of the next time period based on the decision tree.
4.3. Verification of Decision Tree
We randomly select another ten sets of data samples to verify the established decision tree. The data samples and verification results are shown in Table 4.
Table 4 Verification results
| Sample number | Time | Time slot | Working day or not | Weather | Traffic | Holiday or not | Traffic volume in the previous period | Crowding state | Predictive state |
|---|---|---|---|---|---|---|---|---|---|
| 1 | 2014/12/21 | peak | no | influential | large | no | small | severe congestion | smooth |
| 2 | 2014/12/21 | low peak | yes | no influence | small | no | large | smooth | smooth |
| 3 | 2014/12/22 | peak | yes | no influence | large | no | large | smooth | smooth |
| 4 | 2014/12/23 | peak | yes | influential | small | no | large | slight congestion | slight congestion |
| 5 | 2014/12/23 | low peak | yes | influential | small | no | small | smooth | smooth |
| 6 | 2014/12/24 | low peak | yes | influential | small | yes | large | smooth | smooth |
| 7 | 2014/12/25 | peak | yes | no influence | large | yes | large | slight congestion | smooth |
| 8 | 2014/12/25 | low peak | yes | no influence | large | yes | small | smooth | smooth |
| 9 | 2014/12/26 | low peak | yes | no influence | large | no | large | smooth | smooth |
| 10 | 2014/12/27 | peak | no | no influence | small | no | large | smooth | moderate congestion |
It can be obtained from the table that in the ten samples of the verification data, there are seven groups in which the predicted congestion state is the same as the actual traffic congestion state, so it can be concluded that the accuracy rate of the predicted traffic state prediction decision tree of the airport surface is 70%. Through verification, although the constructed decision tree has certain errors in the prediction of traffic congestion state, it is still feasible. In actual work, traffic conditions can also be predicted based on our decision model. When the traffic managers become aware that the future traffic state is severe congestion through our method, they can take appropriate measures in advance to relieve the degree of air traffic congestion and avoid the occurrence of severe congestion.
5. Conclusion
It is an important measure for the controller to ensure the safety of the aircraft, reduce the workload, and improve the operational efficiency by analyzing and predicting the traffic congestion of the airport surface and preparing the solution in advance.
This paper refers to the research on traffic congestion of airport surfaces at home and abroad, and it analyzes the influencing factors of traffic congestion in various airport surfaces. Some extreme factors and unquantifiable factors are excluded due to the limitation of conditions. The decision tree algorithm is selected from many knowledge expression methods to establish a decision tree of traffic state prediction. The decision tree is verified based on the actual operational data of the Atlanta airport surface. We establish a congestion state prediction decision tree for the Atlanta airport, and the prediction accuracy is 70%.
The authors have declared that no competing interests exist.
参考文献
| [1.] |
|
| [2.] |
|
| [3.] |
|
| [4.] |
S. Dept. of Transportation, Cambridge,
|
| [5.] |
|
| [6.] |
|
| [7.] |
|
| [8.] |
|
| [9.] |
|
| [10.] |
|
| [11.] |
|
| [12.] |
|

/
| 〈 |
|
〉 |