Building Energy Consumption Data Index Method in Cloud Computing Environment
Liang Yuan
通讯作者:
版权声明: 2020 【-逻*辑*与-】#x000a9; 2020 Totem Publisher, Inc. All rights reserved.
展开
Abstract
In order to represent the building energy consumption data in the existing relational database system, the traditional method needs to update and store the building location information frequently. This takes up a large amount of resources and drops the performance sharply, resulting in low efficiency of query. In order to overcome these problems, an index method based on hbstr tree in the cloud computing environment is proposed to model the spatial location of buildings and the time attribute of building energy consumption data. Through abstract methods, the frequently updated location and time information can be represented in a static way. On this basis, the building energy consumption data is updated and divided, and the existing relational database is used for storage and processing. The spatial-temporal characteristics of building energy consumption data are fully considered for data compression to obtain feature points, and the maximum and minimum distance method is used to select the initial clustering center. At the same time, combining the advantages of spatiotemporal R-tree, b * tree, and hash table, the index is constructed to realize the effective index of building energy consumption data. The experimental results show that the proposed method can ensure the efficient query of building energy consumption data in large-scale and multi concurrent numbers, and the query accuracy can meet the actual needs.
Keywords:
© 2020 Totem Publisher, Inc. All rights reserved.
1.Introduction
Cloud computing is the result of hybrid evolution of virtualization, utility computing, infrastructure, service, platform as service, and software as service. It is the latest development of distributed computing, grid computing, and parallel computing. In the cloud computing environment, most data management systems can only support simple keyword queries. This single query method limits the type of query interface, which is not conducive to the processing and optimization of the building energy consumption data query in the cloud computing environment. It also reduces the efficiency of the user experience. Future cloud data management systems need to improve the performance of building energy consumption data processing. Therefore, it is very important to design a query optimization strategy according to the characteristics of the cloud computing environment [1].
In order to improve the efficiency and accuracy of building energy consumption data query in the cloud computing environment, database storage and data indexing are researched in this paper. Due to the huge amount of data, virtualization, and service-on-demand of the cloud computing environment, the traditional indexing methods have encountered some new challenges. Therefore, it is of great theoretical and practical significance to develop a method for building energy consumption data indexing in the cloud computing environment [2].
For the building energy consumption data indexing method in the cloud computing environment, some research has been carried out. An indexing method based on deferred update and memo update/insertion junction was proposed by Peng et al. In the representation model of energy consumption data of location building, this method cannot update the location information data of buildings nor modify the location information of database servers. As a result, the location information of buildings cannot correctly reflect the actual situation, the real-time query results cannot be relied on, and the query efficiency is low due to repeated queries [3]. The keyword indexing method based on encoding compression has also been researched. When building the index, we only consider the geographical location of the building and ignore the time information. The cost of data compression is also high, resulting in low efficiency of the final query [4].
With the increasing requirements of comprehensive applications, the full-time moving object data model and its indexing method have been intensively researched. The hybrid indexing method has become a trend. An indexing method based on HBSTR tree, which is a new indexing method combined with multiple indexing methods, is proposed in this paper.
2.Research on Indexing Method of Building Energy Consumption Data in Cloud Computing Environment
2.1. Representation Model of Building Energy Consumption Data in Cloud Computing Environment
In the cloud computing environment, the existing relational database system can support the storage and processing of static building energy consumption data. Meanwhile, the continuous change of building energy consumption data cannot be managed well, because the building energy consumption data in the database is considered to remain unchanged before it is explicitly updated [5]. It needs to be updated and stored frequently, which results in a large amount of computing resources and a sharp decline in performance. At the same time, it will cause real-time query results to expire, which is intolerable. In order to solve these problems, it is necessary to model the spatial location and time attributes of building energy consumption data. Through the abstract method, the frequently updated location and time information can be represented in a static way, so that the existing relational database can be used for storage and processing [6].
In the cloud computing environment, a reasonable building energy consumption data model must consider the factors of access speed, spatiotemporal semantics, and storage space. Spatiotemporal semantics include the structure, temporal structure, temporal relation, spatial relation, and spatiotemporal relationship of spatial entities. Access speed is an important indicator of query and storage efficiency [7].
The specific requirements of building energy consumption data for a spatiotemporal data model in the cloud computing environment are as follows:
1)It can express and query building objectives.
2)It can express the time information and location information of building energy consumption materials. The location information mainly includes building coordinate information and geographic location information.
3)It can express and query spatiotemporal changes in the attribute and object levels as well as the spatiotemporal relation of objects. That is, it can support the representation and query of evolution/degradation and survival changes for a single object.
4)It can be integrated with the existing object relational database and is easy to implement.
Through the previous description, the building energy consumption data in the cloud computing environment is abstractly modeled. For any building target
Assuming a simple case, the energy consumption data of buildings in the cloud computing environment shows a constant growth trend, so the growth function is calculated. Suppose that
Input: Data growth
Output: Specific growth value.
Step 1 Extract raw data.
Step 2 Filter the original data.
Step 3 Output
The time complexity of step 1 is
Therefore, in the representation model of building energy consumption data, according to the change of energy consumption per unit area, different data index plans are submitted. The system will automatically generate an appropriate index plan according to the specific location, area, and other information of the building. At the same time, for the massive energy consumption data, the system allows for the specification of a certain stage of the energy consumption data set. Then, it automatically decomposes it into the corresponding discrete space-time building energy consumption data set.
2.2. Update and Division of Building Energy Consumption Data in Cloud Computing Environment
In the representation model of building energy consumption data, when the unit energy consumption data enters the initial stage of the system, its building energy consumption information is a pre-determined data set. In the actual operation process, the system needs to constantly update the unit building energy consumption data to modify the overall energy consumption information in the database server, so that the building energy consumption information can always correctly reflect the actual situation. There are two typical patterns of energy consumption data submitted to the system in the case of change: change holding and time holding [12].
(1)Change keeping: In the process of energy consumption data index, generally, we always try to extract the standard data in advance according to the plan. However, when the energy consumption data of unit area is updated, it will affect the overall energy consumption data, and a series of changes will be generated in the subsequent building energy consumption index.
(2)Time keeping: In the process of data indexing, we always try to process the data according to the agreement in the plan. When the energy consumption per unit area changes irregularly, the data needs to be corrected in the subsequent building energy index. In the time keeping mode, it is relatively simple to process and update. Only the building energy consumption information of the next key point needs to be adjusted and the corresponding index needs to be changed. The change keeping mode is relatively complex, because in addition to the adjustment of the current building energy consumption information, the subsequent building energy consumption information segments need to be translated [13]. The updating of energy consumption information of location building can be divided into the following two types:
1)Forced update of energy consumption per unit area: When the energy consumption per unit building reaches the corresponding position of a key point, the change of energy consumption per unit building will be updated regardless of whether it exceeds the given threshold value. When the update is forced, the end point of the time stamp of the current building energy consumption information segment needs to be corrected to the actual change, and then the difference between it and the actual value will be calculated. Subsequent changes are corrected [14].
2)Overall energy consumption information update: In the energy consumption data index process, if the deviation between the index result and the actual data reaches or exceeds the preset threshold value, the energy consumption data per unit area will be updated, the database server and the local building energy consumption information will be modified, and the index will be modified. When updating, insert a new key point to divide the current building energy consumption segment into two segments, and then recalculate according to the update request to obtain the time offset to adjust the arrival time of subsequent key points.
Assume
The criterion of division of moving object building energy consumption is as follows:
1)
2)
3)When any direction of a building energy consumption information changes, t is used as a division point, which is arranged in ascending order, denoted as
From the above division of building energy consumption, it can be seen that the change of building energy consumption of
Suppose that the two endpoint values of the linear segment of unit building energy consumption change in time period
According to the above Equations (6) and (7), we can obtain:
According to the above formula, the energy consumption information of buildings in the cloud computing environment can be expressed as a time function in the corresponding time period.
2.3. Compression Method of Building Energy Consumption Data in Cloud Computing Environment
Due to the large scale of building energy consumption data, the traditional indexing method only considers the location of moving objects and ignores the temporal information of moving targets. However, the time series is also an important feature of building energy consumption data. For the compression of the building energy consumption data, not only is the linear characteristic of the building energy consumption data in the geographical location considered, but also the deviation distance of the building energy consumption points is calculated according to the S-dimensional spatiotemporal characteristic of the building energy consumption data. However, this method does not blindly calculate all building energy consumption information, which effectively reduces the execution cost of the data compression algorithm and improves the efficiency of building energy data compression. Traverse all the building energy consumption record points in the building energy consumption data set, and only store the building energy consumption record points that are determined to be the building energy consumption characteristic points. This is used as the building energy consumption data set to establish the building energy consumption index.
According to the characteristics of high density of building energy consumption data, it is assumed that the two building energy consumption recording points move at a constant speed. For a given set of building energy consumption data, it is first sorted into time series by the time attribute, using the compression method based on the space-time characteristics of building energy consumption data. First, all the recording points in the building energy consumption data set are sorted by their time attributes. Then, the first element and the second element of the sequence are regarded as the starting point and reference point of building energy consumption change, and the first and last elements of the sequence are determined to be the characteristic points of building energy consumption. Then, traverse all the building energy consumption record points after the reference point, and calculate the angle between the space line determined by the floating point and the starting point and the space line determined by the reference point and the starting point. If the angle is greater than or equal to the threshold value, traverse all the building energy consumption record points between the floating point and the reference point, and calculate the distance to the line determined by the floating point and the starting point. The largest building energy consumption record point is determined as the feature point, which is stored in the feature point set and returned as the compression result of building energy consumption data.
2.4. Efficient Indexing Method for Building Energy Consumption Data in Cloud Computing Environment
The initialization operation of the maximum and minimum distance method is to select the two objects with the largest similarity distance as the initial clustering center, which effectively avoids the shortcoming that the clustering result is limited by the initialization because of the random selection of the initial cluster center in the traditional k-mean and k-center algorithm. In this paper, combined with the idea and spatiotemporal characteristics, a clustering method for building energy consumption data grouping based on maximum and minimum distance is proposed.
The spatiotemporal distance of the building energy consumption data is given by:
The similarity of building energy consumption data is given by:
The similarity distance of building energy consumption data is given by:
From the above equations, it can be seen that the distance between the two recording points considers not only the geographical location distance but also the temporal distance. If the similarity of building energy consumption data is higher, the similarity distance is smaller. By comparing the similarity distance between two points, the smallest similarity of two points can be found. The idea of maximum and minimum distances is to avoid the influence of outliers in the building energy consumption data set on the grouping result.
3.Experiments
3.1. Researched Region Overview
In order to verify the effectiveness of the building energy data index method in the cloud computing environment, experimental research is carried out. In this paper, buildings in the central urban area of a city are selected as the research area, and the specific distribution of the central urban area is shown in Figure 1.
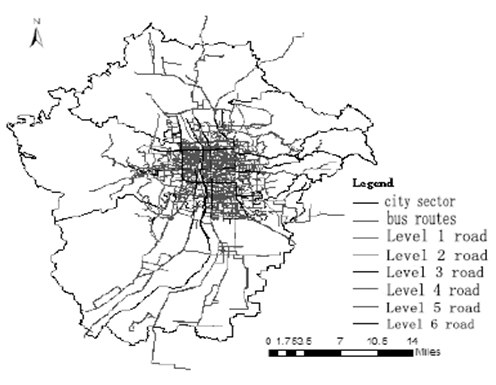
The road network in the city is mainly meshed and circular in shape. There is an outer ring highway and an inner ring road, which has been formed in the old city area in a chessboard pattern. The building energy consumption data of the inner ring road in the old city is researched in this paper.
3.2. Test Data
In this experiment, the city distribution plan shown in Figure 1 is used to verify the effectiveness of the building energy consumption data index method. Each observation change data includes five observation values: building location (spatial coordinate), building area (value), building height (value), building age (text), and observation time (time), as shown in Table 1. The observation frequency of the original building energy consumption data is about one day per time.
Table 1 Example of taxi building energy consumption data in a city
| Attribute | Type | Example |
|---|---|---|
| Building location (latitude and longitude) | Space type | POINT (112.491376) 37.937301) |
| Building area | Numerical type | 20000m2 |
| Building height | Numerical type | 206.58 |
| Age of building | Text type | "normal" |
| Observation time (s) | Time type | "2016-02-26T12:15:28.000+0000" |
3.3. Grid Division and Road Data Conversion
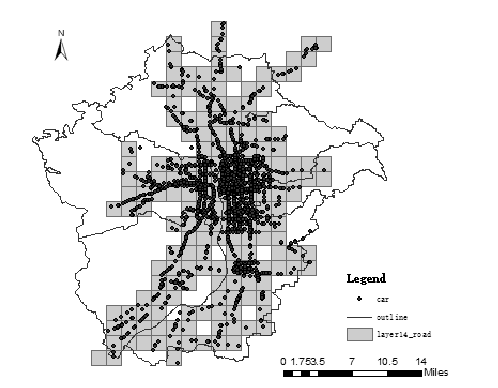
A random sample of 5,000 pieces of data from 500 thousand trajectories is used. According to the criterion that the coefficient of variation CV is less than 95% of the road grid of 1 point falling, the road network cutting layer is divided into 15 layers, and the grid size is a square area with length per side of 0.021972656 degrees, which is an actual region with about 4.877765 km of length per side. The mesh results are shown in Figure 2, each of which establishes a new HBSTR tree index.
Figure 2. Sketch of the 15th layer division with HBSTR tree index of sample data
3.4. Design of Test
The following two tests are set to evaluate the performance of the index. The interest period of "2016-02-01 09:29:08" - "2015-02-01 12:01:09" and the spatial point and spatial range of interest are randomly selected, and the efficiency of filtering query is tested.
1)Test in the case of different amounts of data.
The larger the amount of data, the better the performance of the index method. In this paper, different amounts of building energy consumption data are used to test the performance of the indexing in query.
2)Test in the case of different concurrent numbers.
The number of concurrent users per second is set to 5, 10, 25, 50, 100, and 300 to test the performance of the indexing method.
3.5. Test Environment and Tool
The test uses the open source testing tool Apache JMeter to test the indexing efficiency of this method, Peng et al.'s method (2017), and Zhang and Sun's method (2015). The software environment is shown in Tables 2 and 3.
Table 2 Software environment of server
| Software | Type | Version |
|---|---|---|
| System | Windows server | Windows 2008 R2 server |
| JDK | Java running environment | 1.8.0(64-bit) |
| HBSTR tree | Database | 3.0 (WiredTiger) |
Table 3 Software environment of client
| Software | Type | Version |
|---|---|---|
| System | Windows7 | Ultimate (64-bit) |
| JDK | Java running environment | 1.8.0(64-bit) |
4.Test Results and Analysis
4.1. Test and Analysis in the Case of Different Amounts of Data
According to the amount of data, the efficiency test of the building energy consumption data index constructed by three different methods is carried out respectively. The test results are shown in Table 4.
Table 4 Query response time of building energy consumption data in the case of different amounts of data
| Amount of data | Response time (ms) | ||
|---|---|---|---|
| The proposed method | Peng et al.'s method (2017) | Zhang and Sun's method (2015) | |
| 500 | 37 | 36 | 39 |
| 1000 | 46 | 45 | 48 |
| 5000 | 49 | 48 | 53 |
| 10000 | 53 | 52 | 62 |
| 50000 | 58 | 61 | 78 |
| 500000 | 87 | 110 | 228 |
According to Table 4, the query response time of each indexing method gradually increases when the number of building energy consumption data is increased. The query efficiency of Zhang and Sun's method is better when the number of building energy consumption data is less than 10,000. However, with the increasing amount of data in the building energy consumption data, this method gradually shows disadvantages and has a very slow query time. The test efficiency of Peng et al.'s method is good for different amounts of data. As the amount of data increases, the efficiency of indexing decreases slightly, but the efficiency of the method is still faster than Zhang and Sun's method. For the proposed method, the efficiency is slower than that of the other two methods when the data is small. This is because the data compression and clustering of building energy consumption take a relatively fixed amount of time. However, with the increase in building energy consumption data, the proposed method is much more efficient than the other two methods in dealing with more than 100,000 building energy consumption data queries.
4.2. Test and Analysis in the Case of Different Concurrent Numbers
The test tool Jmeter is used in the test. In the conditions of concurrent numbers of 5, 10, 25, 50, 100, and 300, the response time of the query is tested for building energy consumption data. The test is repeated ten times to reduce the effect of a case abnormality on the result. According to the parameter "90%Line" in the polymerization report (response time of 90% users), in a specified period of time and space, the query efficiency of the proposed method, the Peng et al.'s method, and Zhang and Sun's method is compared. The results are shown in Table 5.
Table 5 Response time of building energy consumption data query in the case of different concurrent numbers
| Concurrent number | Response time (ms) | ||
|---|---|---|---|
| The proposed method | Peng et al.'s method (2017) | Zhang and Sun's method (2015) | |
| 5 | 92 | 118 | 1024 |
| 10 | 105 | 129 | 3875 |
| 25 | 128 | 167 | 8209 |
| 50 | 132 | 216 | 11039 |
| 100 | 157 | 273 | 22754 |
| 300 | 196 | 315 | 52302 |
The test results show that, when the number of concurrent queries increases, the query response time of the three indexing construction methods also increases. In particular, Zhang and Sun's method has the largest time-consuming growth, and the waiting 52s occurs when the concurrency number is 300, which is far beyond the acceptable range for users. Peng et al.'s method and the proposed method are slightly better than Zhang and Sun's method. The advantage is obvious when the number of concurrent users is larger in the building energy consumption data query. When the number of concurrent users reaches 300, the index query response time constructed by this method is 62.2% of Peng et al.'s method.
From the test results, the following conclusions can be drawn:
1)When using the proposed method to construct building energy consumption data index, in the case of different amounts of data and different concurrency numbers, the test result is much better than other methods.
2)When the index number of building energy consumption data is small, the advantage of the indexing method is difficult to maintain. When the number of building energy consumption data increases gradually, the advantage of the proposed method is more obvious.
3)When the number of concurrent query data is small, it is difficult to see the advantages of indexing. When there are more concurrent users, the advantages of the proposed method are gradually reflected.
4)In the building energy consumption data query, the proposed methods first needs to update, divide, compress, and classify the building energy consumption data. With a small amount of data, it does not have an advantage, but with an increasing amount of data, it can ensure a reasonable query efficiency, which is proven by the results shown in Tables 4 and 5.
5. Conclusion
In this paper, the current situation and limited factors of building energy consumption data indexing technology in the cloud computing environment are researched and analyzed. An indexing method based on HBSTR tree is proposed. The compression method based on the spatiotemporal characteristics of building energy consumption data can effectively reduce the execution cost of the data compression algorithm and improve the efficiency of building energy consumption data compression. The maximum and minimum distance method is used to find the clustering center of building energy consumption data, so that the extracted building energy consumption data feature point is more comprehensive. Taking the central city of a city as an example, the indexing strategy of the building energy consumption data is constructed, and the road network indexing based on HBSTR tree is designed according to the urban road network in the center of the city. Compared with the traditional method, the proposed method supports large-scale queries and multi-concurrent queries of building energy consumption data in the cloud computing environment, which is proven by the building energy consumption data query response time. The proposed method has obvious advantages in building energy consumption data queries and is effective.
The authors have declared that no competing interests exist.
参考文献
| [1.] |
|
| [2.] |
|
| [3.] |
|
| [4.] |
|
| [5.] |
|
| [6.] |
|
| [7.] |
|
| [8.] |
|
| [9.] |
|
| [10.] |
|
| [11.] |
|
| [12.] |
|
| [13.] |
|
| [14.] |
|
| [15.] |
-2014,” Ecological Research, Vol. 32, No .
|

/
| 〈 |
|
〉 |