Reliability Estimation of Acrylonitrile Butadiene Styrene based on Cumulative Damage
Ezzahra Nassih Fatima , Wahid Achraf
通讯作者:
版权声明: 2020 【-逻*辑*与-】#x000a9; 2020 Totem Publisher, Inc. All rights reserved.
展开
Abstract
The study of ABS structures in their different stages of life cycle involves taking into account several complicated phenomena. However, the effect of temperature and geometric discontinuity in the material has been identified as morphological mechanisms responsible for the deterioration of its mechanical properties. Within the framework of this problem, this study is interested in the characterization of ABS performance and the evaluation of the effect of the defect on its mechanical behavior. The influence of discontinuity in the material was assessed by a series of uniaxial tensile tests on virgins and artificially damaged specimens. Subsequently, the results of the experimental tests were used to predict the damage and the instantaneous reliability of the material as well as to find a relationship between these two parameters through the fraction of life, which makes it possible to monitor the degradation of the material and predict the moment of acceleration of the damage. This technique can provide manufacturers with a predictive maintenance strategy.
Keywords:
© 2020 Totem Publisher, Inc. All rights reserved.
1.Introduction
Acrylonitrile butadiene styrene (ABS) is an opaque and amorphous thermoplastic polymer made by bulk polymerization of acrylonitrile and styrene in the presence of polybutadiene [1]. It has good surface appearance and high strength properties compared to other types of polymers [2]. Because of its good qualities, ABS is widely used in various fields. Among the most important are keyboard keys, power tool housings, plastic covers, LEGO toys, and parts for household appliances and automobiles [3].
The frequent use of this polymer requires good control of damage and rupture phenomena, hence the interest in conducting a study that follows the evolution of the damage.
Several works on mechanical behavior, on methods for predicting service life, and on the reliability of polymers are available in the literature.
El ouardi et al [4] analyzed the harmfulness of the defect, through a comparative study of the criticality of axial defect versus circumferential defects on polypropylene random copolymer (PPR) pipe, and they predicted the residual life of the defective pipe. They found that axial defects are more dangerous than circumferential defects.
Yap et al [5] presented an experimental-cum-numerical methodology for the characterization of 3D-printed polycarbonate-acrylonitrile butadiene styrene (PC-ABS). On the other hand they studied the effect of raster angle and orientations on the elastic properties of the Fused Deposition Modelling (FDM) printed PC-ABS material.
With the aim of studying the effect of artificial degradation on the mechanical behavior of a thermoplastic material, Sabah et al. [6-7] carried out tensile tests on blank specimens, and others contained geometric defects (discontinuity). Therefore, they used two models to calculate the damage. The first is based on the residual stress method and the second is based on the evolution of static damage stages. In order to determine the critical fraction of life as an extension of this work, they calculated the stress concentration factor Kt for each notched specimen and found an analytical formula that relates the damage factor D and the Kt factor across the fraction of life. Indeed, the present work consists of developing a new model of the reliability analysis from damage calculation based on the artificial rupture of the dumbbell specimens. They identified a new relationship between the damage of the ABS material and its reliability through the fraction of life for predictive maintenance.
2.Material and Experimental Methods
The material studied is acrylonitrile butadiene styrene (ABS). It is a two-phase thermoplastic polymer, manufactured by adding a polybutadiene-based elastomeric material to a styrene acrylonitrile copolymer (SAN) matrix, which is an opaque thermoplastic used by industry for rigid and molded products. It is resistant to heat and ultraviolet radiation. It also has good impact resistance and rigidity, which explains its wide use in the field of transportation, automobiles, sports, and leisure [8].
2.1. Test Specimen for Mechanical Characterization
To characterize the material, we prepared dumbbell specimens according to the ASTM D638-03 [9], ASTM D 882-02 [10], and ASTM D5766M [11] standard.
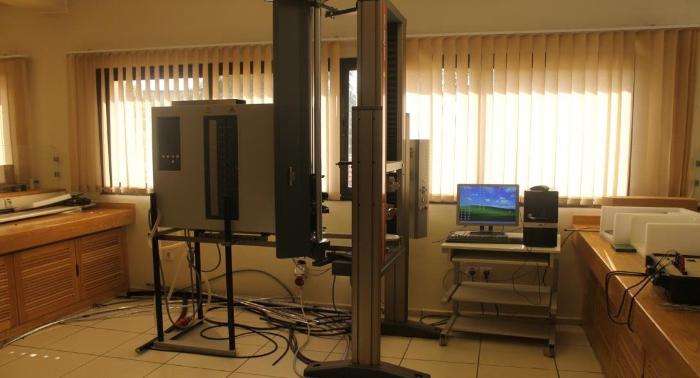
Following this reaction, we carried out tensile tests on blank dumbbell specimens to extract their mechanical characteristics. First, we prepared them in accordance with the ASTM D638-03 standard as shown in Figure 1, and then a series of tensile tests were carried out on the same specimens according to the same standard and using a Zwick roll type tensile machine with a loading speed of 2mm/min, at room temperature and air. Figure 2 shows the specimen assembly.

The average stress-strain curve obtained from the tensile tests is shown in Figure 3.
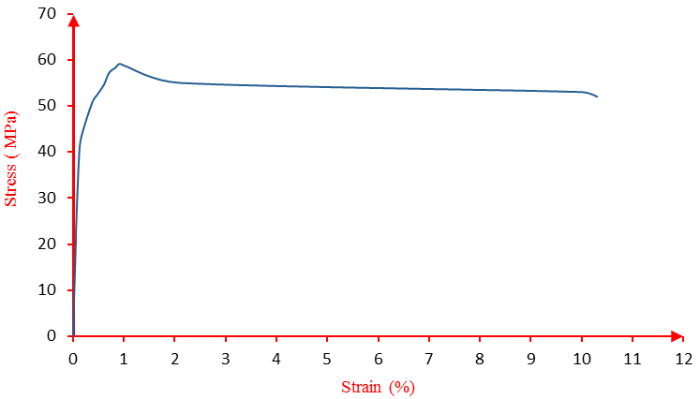
It can be seen from the figure above that the stress evolution as a function of the strain of the ABS material follows the behavior of the polymers at high deformation.
The value obtained for Young's modulus is E = 2GPa, a value comparable with that provided in the literature (between 1.4GPa up to 3.1GPa). The value of the ultimate stress is σu = 59.13MPa, so the conventional elastic limit is σe = 42.5MPa. The tensile strength is 51MPa; once this stress threshold is exceeded, the deformation is no longer linear or reversible. The material begins to deform plastically permanent and homogeneous, and an irreversible deformation appears at the discharge. There is also the appearance of bleaching in the center of the specimen, which marks the hardening zone. This deformation is accompanied by a decrease in the nominal cross-section. The stress remains constant until the specimen ruptures, while the deformation increases. The law of behavior of our material follows the law of behavior of hyperelastic materials.
The mechanical characteristics of our material are summarized in Table 1.
Table 1 The mechanical characteristics of ABS
| Mechanical properties | Young modulus (GPa) | Elastic limit (MPa) | Tensile strength (MPa) | Elongation at break in (%) |
|---|---|---|---|---|
| Values | 2 | 42.5 | 59.13 | 10.3 |
2.2. Notched Specimen
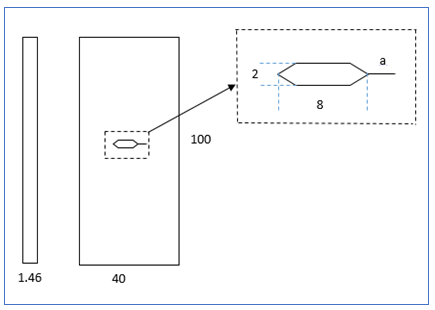
To study the effect of the combined defect on the service life of an ABS material, we prepared a number of drilled and notched specimens with notches of different lengths ranging from 3 to 15mm. These specimens were made according to ASTM D 882-02.
Figure 4 shows the dimensions of the test specimen studied.
As mentioned before, the aim is to follow the damage of the specimen studied. For this, static tests were carried out on artificially damaged specimens at different levels of damage.
3.1. The Effect of Defects on the Mechanical Tensile Behavior of ABS
The stress-strain tensile curves of notched specimens at different levels of artificial degradation are shown in Figure 5.
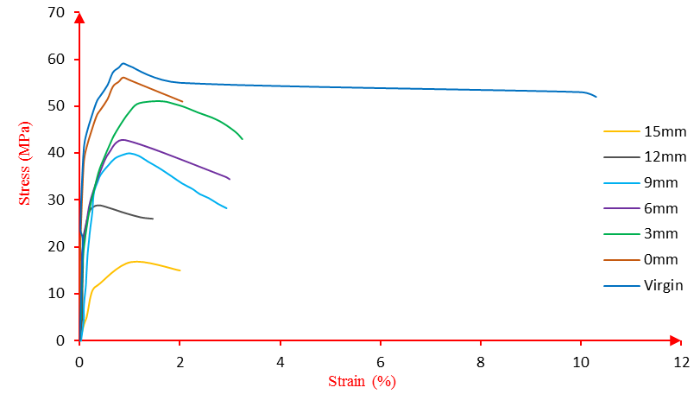
The curves describe the evolution of stress versus strain at the different levels of damage.
For each percentage of damage, the dimensionless stress is calculated. Figure 6 shows the dimensionless stresses at each percentage of damage.
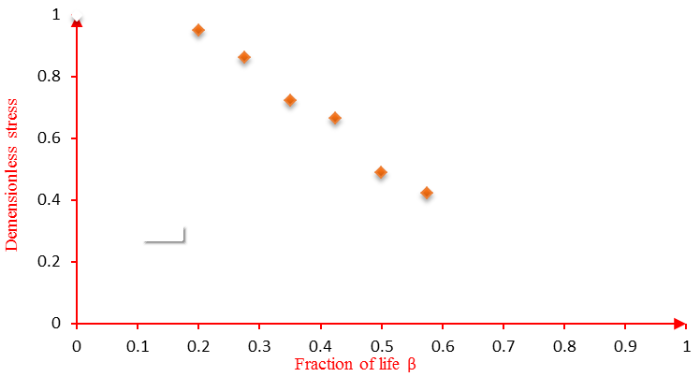
In the continuation of our work, we want to relate the reliability to the damage factor through the fraction of life by using the ultimate residual stresses. For this, we need to express each parameter as a function of the fraction of life; therefore, we used a nonlinear regression method to fit a mathematical equation to relate the non-dimensional stress to the fraction of life.
Suppose that the residual ultimate stress loss is expressed by:
With:
To estimate the three constants a, b, and c of Equation (1), we used experimental point (
Thus, we obtained:
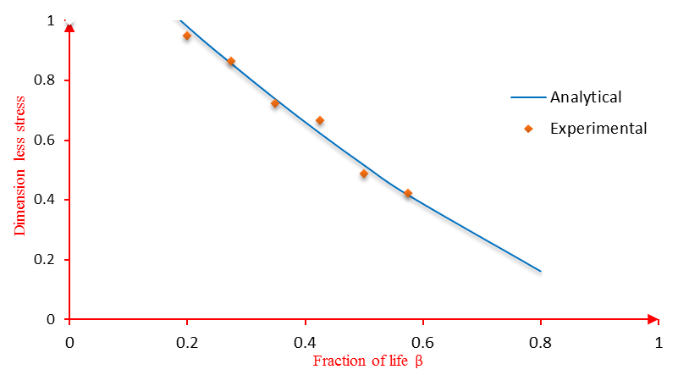
This formula makes it possible to follow the dimensionless stress at each fraction of life. The comparison between the experimental results and the approach given by correlation (1) is illustrated in Figure 7.
Figure 7 shows a significant decrease in dimensionless stress with an increasing fraction of life, and the loss of stress is greater for larger fractions of life. In addition, it can be seen from this result that the deviation between the two analytical and experimental curves of stress loss is very small, which means that analytical Equation (2) is a good approach to stress loss.
3.2. Damage
In order to assess the degree of degradation of the studied structures, the level of damage must be measured. The latter is directly related to the physical properties, hence the importance of adopting a model of the damage as a function of the stress state of the structure under study, which is related to the fraction of life β. Consequently, we choose the static damage model whose expression is as follows [12]:
In addition, the fraction of life β is defined as follows:
With:
For the case of the single and double notch, a is the size of the notch; for the case of the combined defect, it is the sum of the hole diameter and the notch length.
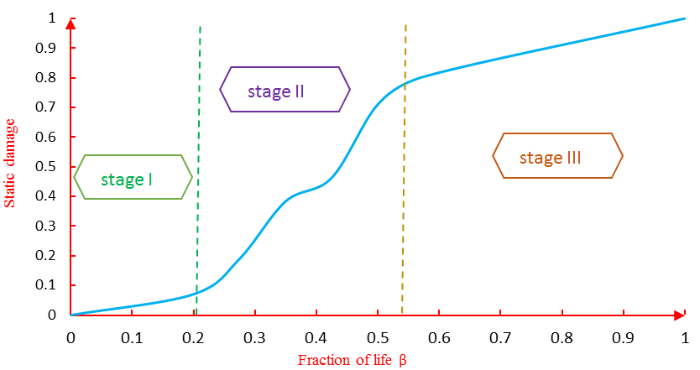
Figure 8 describes the evolution of the damage as a function of the fraction.
We replace the term of dimensionless stress (1) in the damage expression Equation (5):
We get:
With:
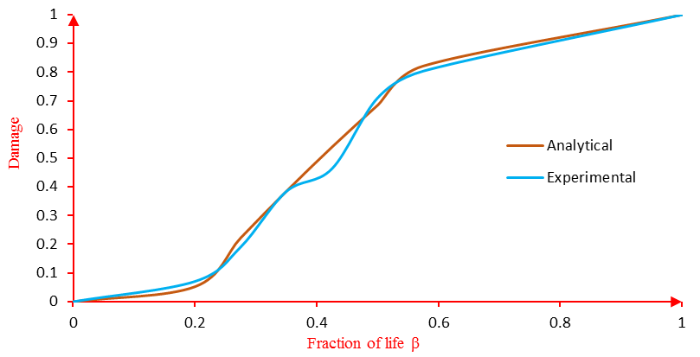
The figure below illustrates the comparison between the experimental damage curve and the analytical curve.
According to Figure 9, we notice that the damage is an increasing function as a function of the fraction of life. It is higher for the most important fractions of life until it reaches a value of 1, which translates into a total failure of the material or, in other words, its fracture. In addition, we notice that the deviation between the experimental and theoretical damage curve given by Equation (6) is negligible, which verifies the validity of our approach.
The change in the curvature of the damage curves allowed us to define the three stages of damage. The first stage corresponds to the initiation of damage, and the second stage corresponds to the propagation of the crack. The last phase of the life cycle corresponds to the unstable phase of the damage; in this stage, at any time, we can expect a total and brutal failure of the specimen, which results in a rupture.
3.3. Reliability
The reliability R of a material is a statistical parameter [13]. It presents the probability of survival of the material. In order to predict the service life of ABS materials, it is necessary to select the appropriate statistical model for the lifetimes of the test samples. For this purpose, we have chosen Weibull's law, which is because the failure rate evolves in any power over time. [11] give the reliability associated with it:
Here, λ and
Time is considered as a succession of period increments (
By exploiting the discretization of the time
We report the form factor β by λ so as not to confuse it with the fraction of life (
Figure 10 illustrates the decline in reliability during operation. We notice that for a fraction of life β=1, the reliability is equal to a non-zero value. This value can be attributed to residual reliability just before material failure. We also notice that the intersection of damage and reliability is located in stage II of damage, which requires predictive maintenance. This intersection point coincides with the reversal of the situation; indeed, the reliability becomes lower than the damage, which corresponds to the acceleration of the latter.
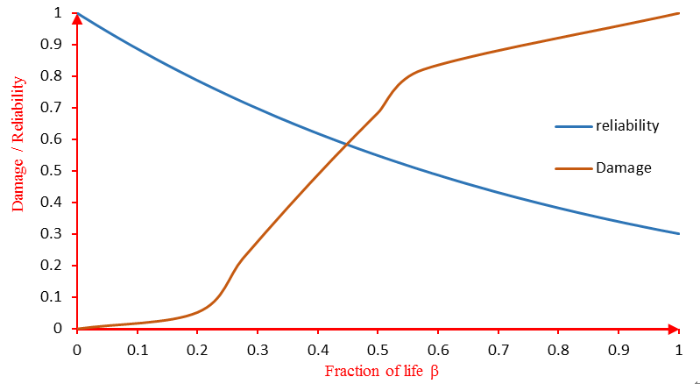
Figure 10. Analytical reliability damage curve as a function of fraction of life
3.4. Relationship Between Damage and Reliability
To determine the relationship between damage and reliability, we replace the expression of the fraction of life β in Equation (5) and obtain:
With boundary condition R = 0 for β = 0 and R = 1/e for β = 1.
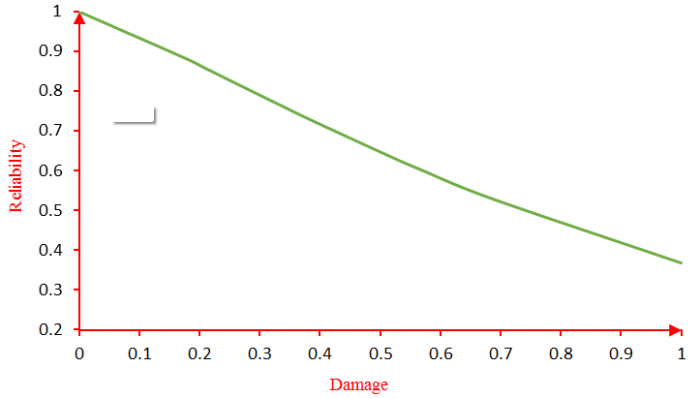
Figure 11 shows the reliability versus damage curve.
Figure 11 establishes the link between reliability and damage according to Equation (9). This link allows us to associate each stage of damage to the corresponding reliability; we notice that when damage equals 1, the reliability is not equal to zero.
Indeed, the damage theory considers that the damage reaches its maximum value 1 when a macroscopic crack appears, but the material retains a certain resistance translated by non-zero reliability. The latter becomes equal to zero when the material is completely broken.
4. Conclusion
In this article, we were able to establish a relationship between the damage and the reliability of a sample of ABS damaged at different notch lengths. We first expressed the damage as a function of the fraction of life using nonlinear regression methods and found the fraction of life as a function of the damage by inverting the function of the damage. The results of the damage curve allow us to determine three stages of the damage and to derive the critical fraction of life βc, which corresponds to the acceleration of the damage. Then, we estimated the reliability of the materials based on the law of Weibull, and the expression used of the reliability is according to the fraction of life; this makes it possible to find a relation between the two parameters of damage and reliability, and find the corresponding reliability for each stage of damage and vice versa.
This approach also allows us to predict the moment of critical damage and, therefore, to intervene in time for predictive maintenance.
The authors have declared that no competing interests exist.
参考文献
| [1.] |
|
| [2.] |
“Acrylonitrile-Butadiene-Styrene (ABS) Polymers,”
|
| [3.] |
|
| [4.] |
|
| [5.] |
|
| [6.] |
|
| [7.] |
|
| [8.] |
|
| [9.] |
|
| [10.] |
|
| [11.] |
|
| [12.] |
Bathias and A. Pineau, (Eds.), “Fatigue of Materials and Structures,
|
| [13.] |
|
| [14.] |
“Wire Rope Reliability Assessment based on Damage Mechanics,” International Journal of Performability Engineering, Vol .
|
| [15.] |
|

/
| 〈 |
|
〉 |