Safety-Instrumented Systems in Oil and Gas Improved Situational Awareness with Embedded Signature Curves in Mimics
Thorrud Benny , Tømmerås Selvik Jon
通讯作者:
版权声明: 2020 【-逻*辑*与-】#x000a9; 2020 Totem Publisher, Inc. All rights reserved.
展开
Abstract
Offshore oil and gas activities involve risks and have the potential for major accidents, where undesirable events can escalate into acute pollution or losses of production and even human lives. To protect against such events, safety-instrumented systems are installed for early alarming, shutdowns, and mitigation of consequences. Safety-instrumented systems are attracting increasing attention. However, the previous five years show an apparently increasing trend in notifications related to so-called 'non-verifiable incidents' in posterity for these systems, where the causal factor often appears to be insufficiently understood and improperly documented at an early stage.<br/>Today's safety-instrumented systems widely record analogue values from a large number of instruments, where automatic alarm and activation are based on pre-configured limits (acceptance criteria). These are raw amperage data that are rarely presented as is in daily operation; instead, they are converted to numerical values and visualized using image processing software, i.e., in mimics. However, this is considered insufficient to establish proper situational awareness. To differentiate between different conditions, the recorded values should be seen in context with system design and expected signature curves for actual activations. <br/>In this article, our hypothesis is that a specific safety-instrumented system, having its defined functionality, will produce a unique signature curve when the assigned function is carried out as intended, and that knowledge of this curve can be used to filter out other faulty conditions. To test this hypothesis, we study relevant data recorded from sprinkler and deluge systems at an offshore oil and gas installation on the Norwegian Continental Shelf (NCS). By embedding trends with recorded data from the instruments into existing mimics, we show, based on the results, that real incidents can be recognized. This can potentially reduce the extent of notifications related to non-verifiable incidents.
Keywords:
© 2020 Totem Publisher, Inc. All rights reserved.
1.Introduction
If an oil and gas related event with major accident potential occurs somewhere at the Norwegian Continental Shelf (NCS), this shall be reported by notification to the Norwegian Petroleum Authority (PSA) [1]. This is to establish additional emergency preparedness on demand. Requirements for notifications and reporting are highlighted in The Management Regulations, where §29 [2] specifies that the operator is required to immediately issue a written notification to the PSA for any event with occurrence or potential for severe safety or environmental outcomes. This means that the operators are required to report critical failures occurring on safety-instrumented systems. These are systems consisting of at least three subsystems (see [3]): sensors (transmitters), logic solvers (including programmable units), and final elements performing a safety function, i.e., capturing the full process from detection to safety protection.
Based on the reported events or incidents, PSAs are then able to evaluate the level of safety within the industry, as well as keep track of incidents related to safety systems that cannot be verified as real in posterity. Alarming and unintentional activation of consequence reducing measures for 'non-verifiable incidents' have several adverse aspects in the form of operational disturbances, stress on facility and personnel, and negative media coverage.
To classify the various incidents, a predefined set of 'danger and accident situations' has been established. Refer to [4] for an overview of the categories. Incidents that cannot be placed into any of the categories are collected in an internal PSA database as 'fault-alarms'. These are the incidents that cannot be verified as real.
Access to the PSA database and a systematic review of the period from 2010 to 2018 form the basis for this paper. The database holds 351 records from more than 90 different installations operating at the NCS in this period. The number of reported incidents in this period is given in Figure 1.
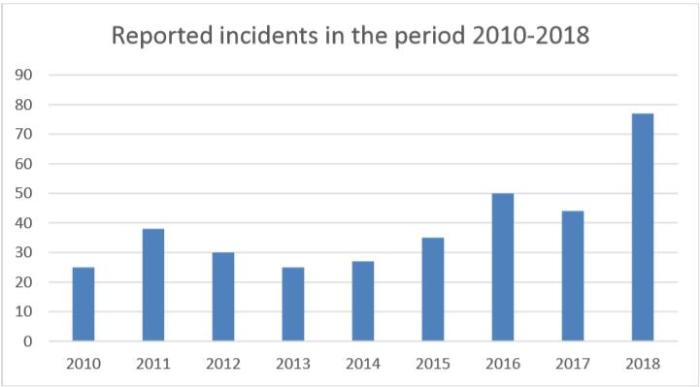
Figure 1. Number of incidents reported to the PSA database per year in the period 2010-2018
The figure shows an increasing trend of incidents in the period from 2013 to 2018, with a somewhat stable level around 30 from 2012 to 2015 and a small decrease in 2017. The three categories that stands out with the most records in the database are 'incorrect human interactions', 'fire and gas detection', and 'active firefighting equipment', where the latter two represent key safety systems. However, when studying these data, we find that the causal factors are in general poorly documented. Many of the notifications report faulty sensor/transmitter and false detection without being able to substantiate the findings and document appropriate measures for follow up. Most likely, the number of non-verifiable incidents follows a similar trend. It could thus be inferred that it can be difficult for operation to establish proper insight at an early stage with a lower situational awareness in operations.
Safety-related events occurring at the oil and gas installations during the operational phase create 'situational awareness' (SA) by influencing both current and future conditions. The situational awareness is about creating attention to the safety implications of the events; see definitions and interpretation of this concept in [5-8]. Endsley [9] referred to a 'three-level model' when describing situational awareness, where information is processed cognitively by first perceiving the available information, then comprehending the information, and finally predicting future states. Refer to Stanton et al. [10] for a broader and more detailed discussion regarding the SA concept.
The SA concept is highly relevant in relation to the increasing automation of operations. According to Singh et al. [11], operator system awareness and manual skills are reduced while monitoring workload is increased, meaning that operators to are moved towards a supervisory controller role [12]. Having such a 'passive' safety design, with a focus on replacing human decisions and interventions by automatic actions, the human factor becomes critical with regards to situational awareness and follow-up after safety-related events or incidents. Issues related to automation systems were brought to attention by Bainbridge [13] in the 1980s through the famous argument of 'ironies of automation'. Many issues are still considered unresolved today [14]. There are different levels of automation [15], but a common factor still needs to be accounted for, i.e., the 'human automation' interaction. In order to facilitate appropriate SA, the available operator tools (e.g. sensor/transmitter readings, software, etc.) must be adopted and suitable for dynamic environments [16].
To identify current conditions and make good decisions, measured values should be seen in context with system design and expectations [17]. Our hypothesis is that a system with a specific functionality, typical active firefighting equipment, will generate a unique signature curve in the mimic image processing software when the assigned function is carried out as intended. This has not yet been tested, but we assume that by trending measured values from a single instrument or a combination of instruments, faulty conditions can be differentiated from intended functionality. To test this hypothesis, the activation of sprinkler and deluge systems recorded at a modern installation on the NCS are provided and discussed. There is reason to believe there is potential that the information provided by these unique curves can increase situational awareness in operations and allow for better decision-making in follow-up.
The subsequent text is organized as follows. Section 2 introduces the current practice related to processing and presentation of analogue signals in safety-instrumented systems, particularly in the logic solvers. Deluge activation is used to illustrate the applied logic. A discussion related to issues considering the current practice is given in Section 3. Section 4 elaborates on how extended situational awareness for sprinkler and deluge performance can be established by embedding trends into existing mimics. Section 5 presents conclusions.
2.Signal Processing in Safety-Instrumented Systems: Current Mimic Practice
The current practice is to configure alarm limits for selected signals, such as gas detectors and pressure transmitters, which will initiate an automatic alarm and actions when the measured analogue value exceeds the pre-configured limits. An example of applied logic is presented in Section 2.1.
The criticality of high output determines the extent of the alarming and whether the equipment is to be shut down. To assist the control room operators in identifying current conditions, dedicated mimics are made for each system. Figure 2 shows a typical mimic for deluge skids with pressure transmitters, valves, and differential filters.
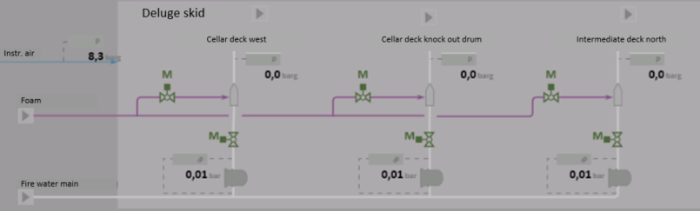
Common for these mimics and systems is the presentation of numerical engineering values converted from raw amperage readings. These values are updated continuously, although they are usually given limited focus prior to activation at the pre-configured limits. Attention is first given when some alarm and actions are initiated. Having sparse information about causal factors, it is difficult for the operators to identify the actual scenario; as a result, all conditions are likely to be handled in the same manner when the logic is triggered. The data gives a perception, but not a context [18-19].
Up-to-date instrumented-safety systems are capable of storing sampled data and produce trends. These trends can be accessed from faceplates but are hardly used in daily operation due to a large number of instruments; besides, the trends are not always easily accessible. It is more common to use the sampled data to search for causal factors and conditions that triggered the activation, after the situation has been clarified and restored.
To visualize current practice related to applied logic for analogue signals in programmable safety systems, an actual release of deluge is used as an example. The example presented in the subsection below illustrates how the function is configured to respond in a digital manner at a pre-configured alarm limit.
Instrumented-safety systems are dependent on reliable logic solvers for the activation of safety functions, including gas detection and the use of active firefighting equipment. NORSOK Standard I-005 [20] defines a set of function templates for logic solvers, where each object has a pre-defined functionality with assigned attributes and input/output terminals. MA represents the function block dedicated to instruments with analogue signals (mA), such as gas detectors and pressure transmitters. The MA block is normally connected to the channels on the input interface card, where the respective detectors and transmitters from the field are terminated. Readings from the field instruments are sampled with a pre-defined scan time and transferred to the 'X' terminal on the MA block (see Figure 3). The template also contains logic for handling alarm limits, blocking, presentation of statuses, etc.
Figure 3 shows the MA template block and associated terminals. The specific terminals highlighted in red are visualized as in Figure 4. The visualization presents a trend from an actual release of deluge collected from an installation on the NCS where time series have been configured on the two terminals highlighted in the figure, as described by Box et al. [21].

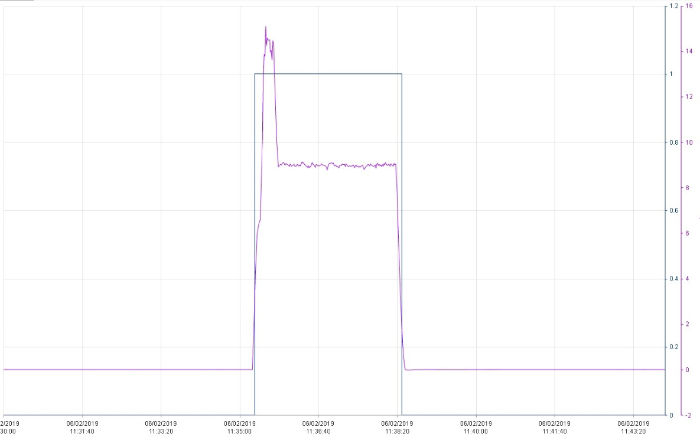
Figure 4. Deluge release - measured pressure and digital response when alarm limit is triggered
It can be observed that when the recorded analogue value (violet) on the 'X' terminal reaches the pre-configured alarm limit of 2 bar (marked with '1' in Figure 4), a digital response (blue) is triggered on the 'AHH' terminal. The logic is basically transferring an analogue value into a digital border limit for further alarming and activation of safety measures.
The current logic is in principle not problematic, as safety is maintained through automatic actions. The problematic part is the current mimic presentation, which is not able to differentiate the various conditions that can produce measurement values higher than the 2 bar alarm limit. Operations are basically left with a numerical value that has exceeded the alarm limit and a digital response curve (AHH terminal) for all conditions, without further context. The next section discusses relevant issues related to the current practice.
3.Discussion
The main function of a safety-instrumented system is to enter a safe state when required and demonstrate the required safety integrity level, as outlined by Rausand [3]. This is maintained through implemented logic according to best practice and relevant governance documents, including the NORSOK S-001 [22] and the NOG 070:2018 [23]. However, reported incidents have clearly shown that such systems could sometimes indicate conditions that cannot be verified as real. In offshore oil and gas environments with harsh conditions, considerable activity, pollution, human errors, and equipment with changing reliability, a wide range of scenarios are possible and must be accounted for.
A faulty sensor/transmitter, or an undesirable change in pressure condition caused by operation of equipment or maintenance, could potentially cause readings that trigger pre-configured limits for alarms and actions. It is unclear how the readings would be from a specific faulty condition, but all other pressure changes will also be intercepted (assuming a reliable transmitter). It is therefore problematic to include compensating measures on the integrated operations (IO) interface that could cope with all possible scenarios without potentially degrading the desired shutdown functionality for real conditions. Introducing additional logic and filters into safety systems for potentially identifying states that are not real could potentially compromise safety; thus, it is not desirable. The consequences could be dangerous situations that are not recognized due to additional uncertainty introduced into shutdown lines.
Instruments are becoming more and more sophisticated and contain a higher degree of self-diagnostics and monitoring than before. This makes it easier to identify equipment that is soon to fail or require preventive maintenance. However, introducing additional electronics and software could potentially increase complexity and vulnerability and add additional sources of errors. Alarms and action are sometimes based on the degraded mode in combination with other instruments in alarm, such as gas detection. If this is not accounted for during testing of other instruments, shutdown lines could potentially be triggered.
Ideally, it would be beneficial if the programmed logic could identify and respond differently to the various scenarios that can occur, to limit operational disturbances and stress on facility and personnel. This is unfortunately not achievable. Due to the sensitivity and the tasks that are assigned to these systems, we must acknowledge that the environment these systems and instruments are prone to, and the instruments themselves, can generate states that must be considered as real until they are further investigated and clarified.
The existing mimics provide limited support to identify the different scenarios that can occur. The presentation of numerical values without context is considered insufficient. A drop of pressure in a piping section for a sprinkler system cannot be differentiated from a faulty sensor/transmitter value or a leakage, unless water is verified as released into the protected area. Due to assumption of a fire, before any verifications are carried out, mustering is often initiated as a precaution. With the current logic and mimic presentation, most activations are responded to in the same manner, even if they preferably should be addressed differently. There is reason to believe that a portion of the records in the database could be related to the absence of situational awareness for the reported incidents.
Over decades, most of these systems have proven themselves reliable, and there are continuous development and improvements to design and technology. However, we must also acknowledge and consider that errors and faulty conditions may appear. Since the logic cannot be programmed to differentiate the various scenarios, situational awareness needs to be strengthened and given adequate attention.
The next section presents two examples for sprinkler and deluge, where unique signature curves of actual releases have been identified. By embedding trends with measured values into existing HMI mimics, real activations can be differentiated from other conditions by providing information in addition to numerical values.
4.Improved Situational Awareness with Embedded Signature Curves in Mimic
This section presents unique signature curves for sprinkler and deluge activations with trending as a tool. All trends in this section are collected from a modern installation on the NCS and are from real and confirmed releases. However, it is important to be aware that these curves will be unique and only apply to the systems installed and in use on the specific installation considered.
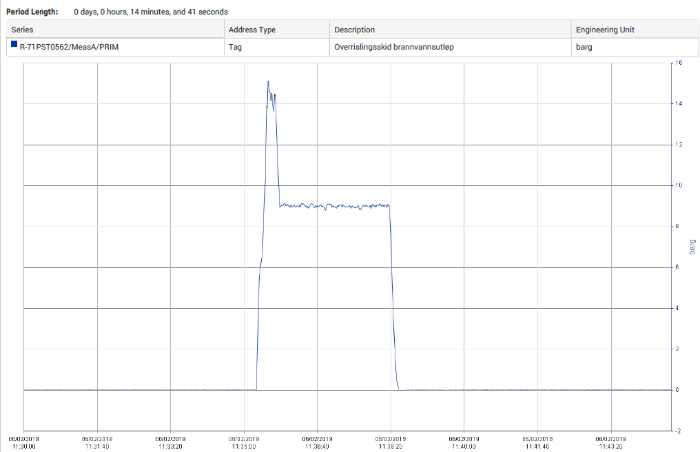
The basis for a sprinkler system is water under a fixed pressure ready to be released. The installed pressure transmitter in the piping segment will typically measure 5 bar under normal conditions. At the end of the piping section, within the area where the nozzles are located, a melting plug is installed. When this plug bursts, the water will be released. When the pressure in the piping section drops due to release of water, the in-ball valve between the piping section and the firewater ring will open and supply water. This will last until the sprinkler system is reset in the field. Figure 5 presents a unique curve for the values measured by the pressure transmitter during an actual release of a sprinkler.

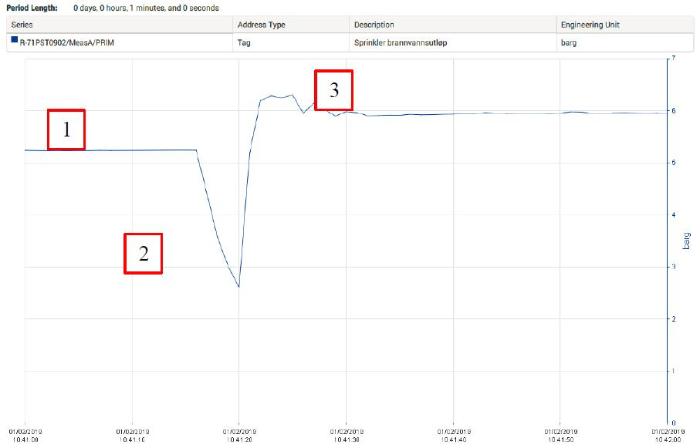
If the curve is seen in context with the system design, the activation response is as expected, which is indicated by the following numbering in the figure:
1)5 bar pressure at normal conditions.
2)Pressure drops suddenly when the melting plug bursts and water is released.
3)Pressure builds up and stabilizes at 6 bar when the in-ball valve to firewater opens.
Deluge is a system with a pressure of 0 bar under normal conditions. Before any increase in pressure can be measured, the in-ball valve between the piping section (where the transmitter is located) and the firewater ring needs to open and supply water. Figure 6 presents a unique curve for the values measured by the pressure transmitter during an actual release of deluge.
If the curve is seen in context with the system design, the activation response is as expected, which is indicated by the following numbering in the figure:
1)0 bar pressure at normal conditions
2)A sudden increase in pressure when the in-ball valve to firewater ring opens.
3)The supply of firewater stabilizes at 9 bars.
4)The system is reset in the field and falls back to 0 bar.
Sometimes, more than one instrument is needed in order to identify the unique signature curves. If the curves for the deluge release example in Figure 6 potentially can be misinterpreted with other conditions, measured values from additional instruments could then be included in the same window for better recognition. When the in-ball valve to the firewater ring is opened and water supplied, the pressure in the firewater ring will drop until the firewater pumps start up and supply additional seawater. Figure 7 presents unique curves for the values measured by the pressure transmitter in the deluge piping section in combination with one of the pressure transmitters on the firewater ring.
The blue curve is still the pressure transmitter as presented in Figure 6. The violet curve is the pressure transmitter from the firewater ring, and the following can be read:
1)12 bar pressure at normal conditions
2)Pressure drops suddenly to 9 bar when the in-ball valve to deluge is opened
3)The fire pumps start and supplies seawater to the ring, while the pressure increases and stabilizes at 18 bar
4)The fire pumps are stopped, and the pressure falls gradually back to 12 bar
As presented in the figures above, data from readings can be combined and presented as meaningful information. By seeing the two curves presented in Figure 7 in context with system design, it is fairly simple to support the activation of deluge in the protected area.
The next challenge, then, is how the mimic can present this information in an intuitive manner with ease of access.
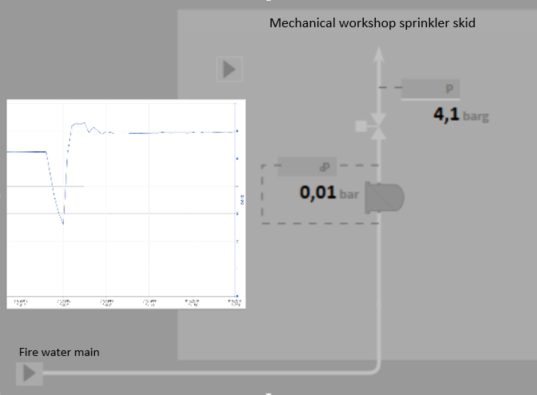
Currently, dedicated mimics are already available for the areas protected by the two systems. However, only numerical values are displayed, providing limited information. The pressure transmitter presents the current value readings, but it cannot differentiate actual incidents from other conditions since there is no context. Figure 8 presents a mimic for a sprinkler system protecting a mechanical workshop, initially with (1) as the only transmitter interface.
To add information to the existing mimic, a trend with the measured values can be embedded, as illustrated in (2). As presented, operator knowledge of system design and unique release curve from the sprinkler system is a pre-requisite for recognition. To potentially limit the need for detailed knowledge, a reference curve could be included in the same trend. The upper part displays dynamic live values, while the lower part displays a static reference curve for an actual activation and comparison (having multiple tabs in the trend window is also a possible approach). This will not only give quick and easy access to information, but also provide increased situational awareness for the systems and instruments under consideration due to the recognition of actual activation.
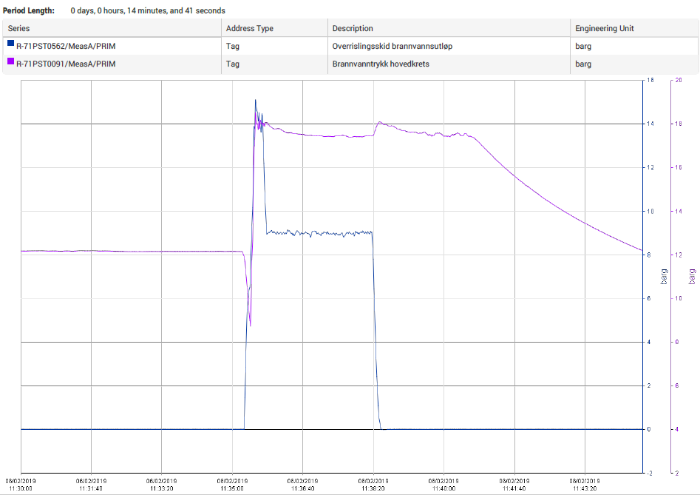
Figure 7. Deluge and firewater ring - changes in pressure during an actual release
The tool is considered suitable for real-time presentation and is assumed to add value to decision making and follow-up in operations. The trends are available on newer programmable safety systems and can be embedded and pre-configured for selected instruments and terminals based on desired demand. The approach is not only applicable to the examples presented in this article but can be used for all systems and instrumentations, where unique signatures curves can be identified and provided for recognition.
Fire and gas detection is also a major contributor to 'non-verifiable incidents'. Trending of individual instruments alone will not be enough to establish a comprehensive picture, due to technology in use and dynamic leak and dispersal scenarios. A possible approach would be to investigate a network concept, where data from individual detectors are combined and seen in context, for improved situational awareness. Different issues will require different tools, which can identify various conditions in dynamic environments.
5.Conclusion
The main conclusions drawn from the contents of the PSA database, which present a trend in safety-related events, is an increase in reported notifications related to 'non-verifiable incidents', where the causal factors are neither sufficiently understood nor documented at an early stage. There is reason to believe that this is also the situation for real incidents. To be able to differentiate between various conditions that can occur in a dynamic environment, supporting systems must arrange for an intuitive and holistic presentation of relevant information.
Currently, safety-instrumented systems focus on replacing human decisions and interventions by automatic alarms and actions, but recorded values from instruments are rarely monitored prior to activation of the pre-configured alarm limits. This, in combination with mimics presenting numerical values from the instruments, are insufficient at establishing adequate situational awareness for differentiating faulty conditions from actual activations.
This article presents a way to add information for better decision-making through increased situational awareness. By embedding trends with measured values from instruments under consideration into existing mimics, real incidents can be recognized through unique signature curves. Where this is achievable, systems and instruments having deviating readings can also be identified. This can potentially reduce uncertainties related to safety instrumented system events and establish an improved foundation for further decision-making and follow-up in operations. Increased situational awareness will likely reduce the number of notifications labelled as 'fault-alarm' for offshore safety systems.
Acknowledgements
The authors are grateful to the company for giving permission to present the figures from the offshore unit.
The authors have declared that no competing interests exist.
参考文献
| [1.] |
d. Notification of Hazards and Accidents, (https://www.ptil.no/en/contact-us/reporting-to-the-psa/notification-of-hazards-and-accidents/,
|
| [2.] |
ptil.no/en/regulations/all-acts/?forskrift=611,
|
| [3.] |
|
| [4.] |
standard.no/,
|
| [5.] |
standard.no/,
|
| [6.] |
norskoljeoggass.no/contentassets/adc7e1512f90400cb7fe 9f314600bed6/norwegian-oil-and-gas-guidelines-070-rev-3-june-2018.pdf,OG 070: Application of IEC 61508 and IEC 61511 in the Norwegian Petroleum Industry (Recommended SIL Requirements), 3rd Edition, Norwegian Oil and Gas Association, (https://www.norskoljeoggass.no/contentassets/adc7e1512f90400cb7fe 9f314600bed6/norwegian-oil-and-gas-guidelines-070-rev-3-june-2018.pdf,
|
| [7.] |
|
| [8.] |
|
| [9.] |
Box, G. M. Jenkins, G. C. Reinsel, and G. M. Ljung, “Time Series Analysis: Forecasting and Control,
|
| [10.] |
|
| [11.] |
|
| [12.] |
|
| [13.] |
|
| [14.] |
|
| [15.] |
“Part 1: Developing High-Performance HMIs,”
|
| [16.] |
“High Performance HMI Handbook,” 360 Digital Books,
|
| [17.] |
|
| [18.] |
|
| [19.] |
“Part 1: High-Performance HMIs: Designs to Improve Operator Effectiveness,”
|
| [20.] |
“Part 2: High-Performance HMIs: Designs to Improve Operator Effectiveness,”
|
| [21.] |
“Reliability of Safety-Critical Systems - Theory and Applications,” Hoboken, John Wiley & Sons, Inc.,
|
| [22.] |
|
| [23.] |
|
| [24.] |
|
| [25.] |
|

/
| 〈 |
|
〉 |