


1. Introduction
In 1947, Freudenthal [1] proposed the famous stress-strength interference model, which formed the basis of quantitative analysis design of mechanical component reliability. In the stochastic probabilistic reliability analysis method, the stress and strength are usually assumed as static random variables that are independent of each other [2-7]. In practice, due to the long-term effects of mechanical parts under dynamic load, fatigue, wear, corrosion, aging, and other factors cause component strength monotone attenuation. On the other hand, due to crack initiation, deepening of corrosion degree, and changes of dimension gap, the stress value of the force point changes with time. In addition, it is possible to be subjected to random impact stress, which results in a random process rather than constant [8-11]. Therefore, the dynamic analysis of stress-strength double random process interference is more practical for the reliability design of mechanical parts.
The allowable load (comprehensive strength) for mechanical parts usually increases with the increase in size parameters of the parts, material physical properties, and good surface quality factor. Meanwhile, parts of the stress of the focus of variable (consolidation stress) change because of the same kinds of factors. Thus, the stress-strength of the parts is correlated. The reliability calculation of independent interference is only a simplified approximation of such characteristics, and the correlation failure is the universal characteristic of mechanical reliability engineering. It is also a key issue to be solved urgently [12-16]. The stress-strength correlation interference model considers the correlation and is more widely applied.
For high reliability and long-life products, using traditional life tests and even accelerated life tests is often difficult to obtain the full life span of the data samples within the given time, which causes the classical failure statistical methods to lose efficacy. Fatigue, corrosion, aging, and other degradation characteristics are typically presented in the failure process of high reliability and long-life products. During the test, the degradation parameters of this kind of products are tested, and the degraded data is obtained while the statistical analysis is also completed, which is an effective and cost-saving reliability evaluation method [17-24].
In this paper, the finite element analysis software ANSYS is used to calculate the equivalent stress of a loaded hollow shaft, and the node Von Mises stress value is extracted to verify the correlation between the machinery of the hollow shaft Von Mises stress and parts comprehensive strength component (modulus of elasticity). Then, based on the Copula function, the reliability calculation model of stress-strength correlation is built. Lastly, with the performance degradation data of high long-life mechanical products, a deterministic trend combination time sequence model is adopted to give the reliability prediction method for the product reliability under the dynamic interference of stress-intensity correlation.
2. Model Assumptions and Symbols
For high reliability and long-life mechanical parts, the test results are obtained by testing the parameters (such as crack length, corrosion depth, abrasion degree, etc.) of the machine parts. Assuming that:
(1) n samples were tested and the interval time was the same. The test time is denoted as ${{t}_{0}},{{t}_{1}},\cdots ,{{t}_{m}}$.
(2) The comprehensive strength of the part under load time tis $\{\delta (t),t\in T\}$. The density function of $\delta (t)$ is ${{f}_{{{\delta }_{t}}}}(\delta ,\mathbf{\beta }(t))$, and the corresponding distribution function is ${{F}_{{{\delta }_{t}}}}(\delta ,\mathbf{\beta }(t))$. $\mathbf{\beta }(t)$isthe distributed characteristic parameter, which in normal distribution is $\mathbf{\beta }(t)=({{\mu }_{\delta }}(t),{{\sigma }_{\delta }}(t))$.
(3) The combined stress of the parts is $\{S(t),t\in T\}$, in which the density function of $S(t)$ is denoted as ${{g}_{{{s}_{t}}}}(s,\mathbf{\alpha }(t))$, and the distribution function as ${{G}_{{{s}_{t}}}}(s,\mathbf{\alpha }(t))$. $\mathbf{\alpha }(t)$isthe distributed characteristic parameter.
(4) The related structure of comprehensive strength $\delta $ and comprehensive stress $S$ is expressed by Copula ${{C}_{\theta }}(u, v)$, in which $\theta$ is the relative degree parameters of the two. The Gumbel Copula and the Clayton Copula are common positive/negative Copula families in engineering.
It can be proved by the limit theory and by Robida’s law that when $\theta \to 1$, the variables described in ${{C}^{Gum}}$ tend to be independent of each other; when $\theta \to 0$, the variables described in ${{C}^{Gum}}$ tend to be perfect positive correlation; when $\theta \to -1$, ${{C}^{Cla}}$ reflects a completely negative correlation; and when $\theta \to 0$, ${{C}^{Cla}}$ tends to be independent.
(5) The performance test data of the ith test time ${{t}_{j}}$ is ${{x}_{i}}({{t}_{j}}),$($i=1, 2,\cdots , n;\ j=1, 2,\cdots , m$).
3. Statistical Analysis of Correlation Interference Between Stress-Strength Components
In this section, a large finite element analysis software ANSYS is applied for the stress calculation of mechanical parts. The model consists of a hollow shaft and a disk. The diameter of the disc is 200mm, the thickness is 25mm, the outside/inside diameter of the hollow shaft is 35mm/25mm, and the length is 150mm. The model adopts the SOLID45 unit, with a total of about 5040 units and 6720 nodes. The finite element model is shown in Figure 1. The hollow shaft and the disc are connected under an interference fit, and the interference amount is 0.04mm. The nonlinear analysis was calculated by using ANSYS, and the load was applied to the axial end with a weight of 120N. The materials used in the finite element calculation are CL60 steel, class B wheel steel, aluminum, and other 20 materials, as shown in Table 1.
Figure 1.
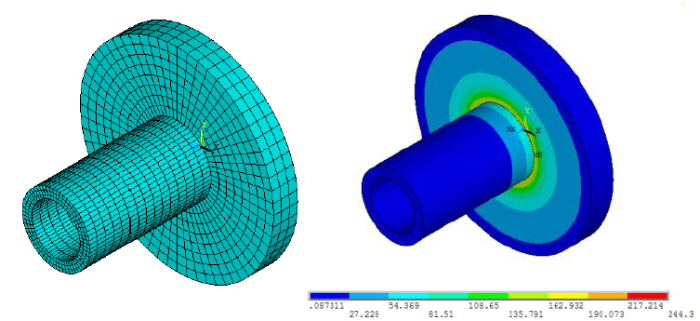
Figure 1.
ANSYS computing model of hollow shaft and disk assembly
Table 1. The elastic modulus of 20 materials used in the parts
| No. | Material | Modulus of elasticity/GPa |
|---|---|---|
| 1 | Cl60 steel | 205 |
| 2 | B-wheel steel | 192 |
| 3 | 45# steel | 206 |
| 4 | Aluminum | 71.7 |
| 5 | Porcelain | 55 |
| 6 | Lead | 17 |
| 7 | Gray cast iron | 130 |
| 8 | Cast aluminum bronze | 105 |
| 9 | Cold-drawing brass | 95 |
| 10 | Rolling zinc | 84 |
| 11 | Cast iron | 100 |
| 12 | Stainless steel | 190 |
| 13 | Magnesium | 44.8 |
| 14 | Nickel | 207 |
| 15 | Glass | 46.2 |
| 16 | Graphite | 36.5 |
| 17 | Titanium | 102.04 |
| 18 | Tungsten | 344.7 |
| 19 | Wood | 11 |
| 20 | Rubber | 0.00784 |
Figure 2.
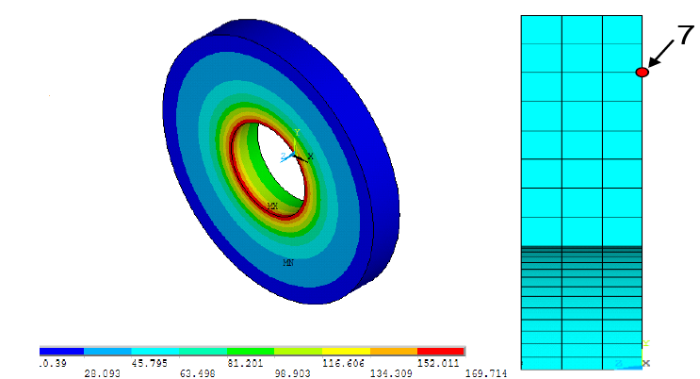
Figure 2.
Finite element calculation of disk ANSYS
Table 2. Elastic modulus of 20 materials used in the parts
| No. | Material | Von Mises/MPa |
|---|---|---|
| 1 | Cl60 steel | 13.98746 |
| 2 | B-wheel steel | 12.9309 |
| 3 | 45# steel | 13.83837 |
| 4 | Aluminum | 4.94067 |
| 5 | Porcelain | 3.64025 |
| 6 | Lead | 1.20912 |
| 7 | Gray cast iron | 8.84996 |
| 8 | Cast aluminum bronze | 7.0457 |
| 9 | Cold-drawing brass | 6.22824 |
| 10 | Rolling zinc | 5.66791 |
| 11 | Cast iron | 6.62864 |
| 12 | Stainless steel | 12.95731 |
| 13 | Magnesium | 3.09795 |
| 14 | Nickel | 14.06966 |
| 15 | Glass | 3.08982 |
| 16 | Graphite | 2.5808 |
| 17 | Titanium | 6.94558 |
| 18 | Tungsten | 23.39905 |
| 19 | Wood | 0.75896 |
| 20 | Rubber | 0.00284 |
SPSS isutilized to analyze the elastic modulus of the material and the calculated Von Mises stress value. Moreover, the distribution was fitted and the characteristic parameter values were obtained. The statistical results of the characteristic parameters are shown in Table 3.
Table 3. The elastic modulus of 20 materials and the corresponding Von Mises stress distribution parameters
| Modulus of elasticity | Von Mises stress | |
|---|---|---|
| N | 20 | 20 |
| Mean | 112.15 | 7.59346 |
| Std. Deviation | 87.665 | 5.94303 |
| Minimum | 0 | 0.00284 |
| Maximum | 345 | 23.39905 |
Based on the comparison of normal distribution, uniform distribution, logarithmic normal, and exponential distribution, Table 4 shows the optimal approximate distribution of SPSS fitting.
Table 4. The elastic modulus of 20 materials and SPSS of corresponding Von Mises stress were fitted
| The fitting of exponential distribution | Modulus of elasticity | Von Mises stress | |
|---|---|---|---|
| N | 20 | 20 | |
| Exponential parameter | Mean | 112.15 | 7.5935 |
| Most extreme differences | Absolute | .129 | .138 |
| Positive | .108 | .107 | |
| Negative | -.129 | -.138 | |
| Kolmogorov-smirnov z | .578 | .618 | |
| Asymp. Sig. (2-tailed) | .892 | .840 | |
With the data of statistical samples in Tables 1 and 2, set the parts material elastic modulus for $X$ and the corresponding ANSYS to calculate the Von Mises stress for $Y$ to validate the mechanical parts of comprehensive strength, the modulus of elasticity for the intensity component, and the correlation between the parts under stress. The joint scatter of $X$ and $Y$ , i.e., $({{x}_{i}},{{y}_{i}}),\ (i=1, 2,\cdots , 20)$, is shown in Figure 3.
Figure 3.
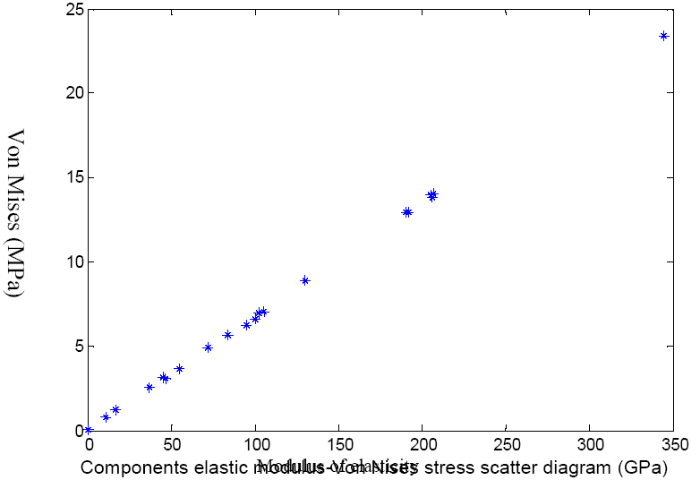
Figure 3.
Components elastic modulus -Von Mises stress scatter diagram
According to the correlation between material elastic modulus X described in Figure 3 and the corresponding Von Mises stress Y, and combined with the fitting density function, ${{f}_{X}}(x),\,{{g}_{Y}}(y)$, shown in Table 4, the Gumbel copulas is used to build its related structure. It estimates the related degree of maximum likelihood forthe result where $\hat{\theta }\approx $0.05. The random simulated scatter diagram of copula ${{C}^{Gum}}(u, v;\hat{\theta }=0.05)$ is shown in Figure 4.
Figure 4.
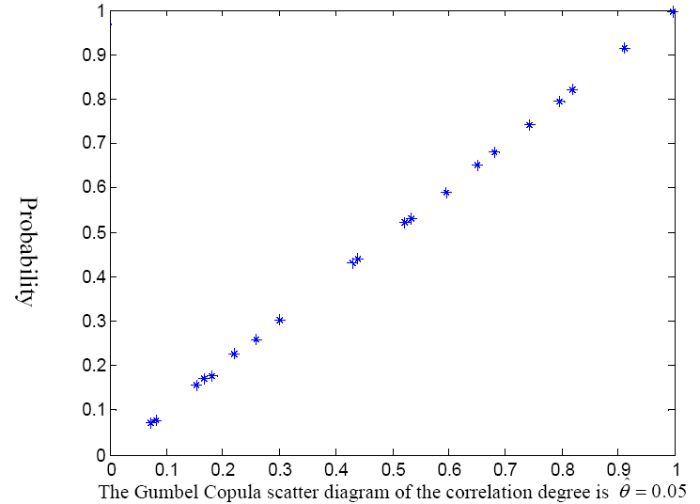
Figure 4.
The Gumbel Copula scatter diagram of the correlation degree is $\hat{\theta }$=0.05
Similarly, the yield strength, tensile strength, shear strength, and other strength components of the 20 materials were analyzed and fitted to determine the density function of the component comprehensive strength $\delta (t)$ as ${{f}_{{{\delta }_{t}}}}(\delta ,\mathbf{\beta }(t))$, and the comprehensive stress density function as ${{g}_{{{s}_{t}}}}(s,\mathbf{\alpha }(t))$. Also, the Copula selection and the correlation degree parameter estimation of $\hat{\theta }$ were completed.
4. The Component Reliability Calculation Model based on the Stress-Strength Correlation
In mechanical reliability design, the traditional stress-strength interference model assumes that the integrated stress $S$ and the comprehensive strength $\delta $ are independent of each other. The classical parts reliability prediction model is
The correlation between $\delta $ and $S$ is presented that for an arbitrary $(x, y)\in {{R}^{2}}$,
The corresponding structure is characterized by Copula
The Sklar theorem [25] guarantees the existence and uniqueness of the Copula ${{C}_{\theta }}$ in any two-dimensional random variable $(X, Y)$.
Theorem 1 [25] Let the marginal distribution function of the two-dimensional random variable be $F(\cdot ),\text{ }G(\cdot )$. Then, there exists onlythe two-dimensional Copula ${{C}_{\theta }}(u, v)$, which makes it arbitrary $x, y\in \bar{R}$,
If the correlation between X and Y is not considered, this meansthey are independent of each other. Then,
In this situation, the reliability of the parts under stress $S$ and strength $\delta $ is
In the situation that the integrated stress and comprehensive strength of the parts are independent, $\frac{{{\partial }^{2}}{{C}_{\theta }}(u, v)}{\partial u\partial v}=1$,and then
The results are consistent with the classical independent interference reliability calculation model. In fact, an independent relationship is only a special case of correlation, and the independent interference model is only a simplified special case of the correlation interference model.
5. Dynamic Timing Reliability Statistical Analysis of Long-Life Mechanical Parts
5.1. Dynamic Timing Estimation of Characteristic Parameters of Degradation Strength Distribution
According to the performance degradation data ${{x}_{i}}({{t}_{j}})$ samples of ${{t}_{j}}$ at the time of detection, the dynamic strength samples, ${{\delta }_{i}}({{t}_{0}}),{{\delta }_{i}}({{t}_{1}}),\cdots ,{{\delta }_{i}}({{t}_{m}})$, of the parts are transformed based on the method of strength determination [26-27]. The distribution type ${{f}_{{{\delta }_{t}}}}(\delta )$ is determined by non-parametric distribution fitting. In most working conditions, the normal distribution is the most common situation for the random diversity of the interfering factors, so the normal distribution is chosen to be related.
The estimation of distribution characteristic parameters $\mathbf{\beta }(t)$ is realized with maximum likelihood estimation:
By solving the likelihood equations, we get the parameter vector estimation sequence of $(t={{t}_{0}},{{t}_{1}},\cdots ,{{t}_{m}})$and the moment component strength $\mathbf{\hat{\beta }}(t)=({{\hat{\mu }}_{\delta }}(t),{{\hat{\sigma }}_{\delta }}(t))$, in which
$\{{{\hat{\mu }}_{\delta }}(t)\}=\{{{\hat{\mu }}_{\delta }}({{t}_{0}}),{{\hat{\mu }}_{\delta }}({{t}_{1}}),\cdots ,{{\hat{\mu }}_{\delta }}({{t}_{m}})\}$, $\{{{\hat{\sigma }}_{\delta }}(t)\}=\{{{\hat{\sigma }}_{\delta }}({{t}_{0}}),{{\hat{\sigma }}_{\delta }}({{t}_{1}}),\cdots ,{{\hat{\sigma }}_{\delta }}({{t}_{m}})\}$
Due to the long-term dynamic load of mechanical parts, its strength $\{\delta (t)\}$ is attenuated randomly. The dynamic components $\{{{\hat{\mu }}_{\delta }}(t)\}$ and $\{{{\hat{\sigma }}_{\delta }}(t)\}$ of the characteristic parameter vector $\mathbf{\hat{\beta }}(t)$ show the deterministic trend sequence. For this purpose, the dynamic effect of the fitting intensity parameters of the quadratic mean trend model is established:
Where ${{c}_{i}},\text{ }{{d}_{i}},\text{ }(i=0, 1, 2)$ is the parameter of undetermined trend, which can be processed by standard regression analysis. First, the concrete form is fitted, namely, based on the least squares estimation method. With the empirical samples $\{{{\hat{\mu }}_{\delta }}({{t}_{0}}),{{\hat{\mu }}_{\delta }}({{t}_{1}}),\cdots ,{{\hat{\mu }}_{\delta }}({{t}_{m}})\}$ and $\{{{\hat{\sigma }}_{\delta }}({{t}_{0}}),{{\hat{\sigma }}_{\delta }}({{t}_{1}}),\cdots $$,{{\hat{\sigma }}_{\delta }}({{t}_{m}})\}$, the determination of the estimated value ${{\hat{c}}_{i}},\text{ }{{\hat{d}}_{i}}$ is completed. $\mu (t)$ and $\sigma (t)$ are the wide stationary process of the zero mean, and then the residual $\{{{\hat{\mu }}_{\delta }}(t)-\mu (t)\}$ and $\{{{\hat{\sigma }}_{\delta }}(t)-\sigma (t)\}$ are analyzed and modeled in the stationary process. Through the model (12), the dynamic prediction of the characteristic parameters${{\hat{\mu }}_{\delta }}({{t}_{d}})$ and ${{\hat{\sigma }}_{\delta }}({{t}_{d}})$ of the degradation intensity $\{\delta ({{t}_{d}})\}$ of the high long-life machine parts in the future ${{t}_{d}}$ is completed. Thus, the distribution density function ${{f}_{{{\delta }_{{{t}_{d}}}}}}(\delta ,\mathbf{\beta }({{t}_{d}}))$ of the component strength in ${{t}_{d}}$ time is determined.
For the dynamic distribution density function ${{g}_{{{s}_{t}}}}(s,\mathbf{\alpha }(t))$ of the time stress course of the parts under the load, the same can be obtained according to the above time $\{S(t)\}$ sequence statistical methods, which will not be repeated here.
5.2. Calculation of Dynamic Coherence Reliability of Stress-Strength and Estimation of Related Degree Parameters
Combined with stress-strength interference correlation of the static reliability calculation model (9) and the above section of part stress, a statistical method to determine the dynamic distribution of intensity and then the high long-life part time dynamic reliability model is expected in the future time ${{t}_{d}}$.
For the determination of the correlation degree ${{\theta }_{{{t}_{d}}}}$ of the components’ comprehensive stress process $\{S({{t}_{d}})\}$ and the degradation intensity $\{\delta ({{t}_{d}})\}$ in the correlation interference model, it can be based on the empirical sample ${{\delta }_{i}}({{t}_{j}}),\text{ }{{s}_{i}}({{t}_{j}}),$($i=1, 2,\cdots , n;\ j=1, 2,\cdots , m$), and the second phase maximum likelihood estimation obtains${{\hat{\theta }}_{{{t}_{j}}}}$.
Where ${{c}_{{{\theta }_{{{t}_{j}}}}}}$ and ${{C}_{{{\theta }_{{{t}_{j}}}}}}$ are the density function, i.e., ${{c}_{{{\theta }_{{{t}_{j}}}}}}=\frac{\partial {{C}_{{{\theta }_{{{t}_{j}}}}}}({{u}_{1}},{{u}_{2}},\cdots ,{{u}_{p}})}{\partial {{u}_{1}}\partial {{u}_{2}}\cdots \partial {{u}_{n}}}{{|}_{{{u}_{k}}={{F}_{{{X}_{k}}}}({{x}_{ik}}({{t}_{j}}),{{{\hat{\mu }}}_{{{X}_{k}}}}({{t}_{j}}),{{{\hat{\sigma }}}_{{{X}_{k}}}}({{t}_{j}}))}}$.
In most conditions, due to the size of the parts abrasion, poor surface quality, aging, corrosion, fatigue, and other reasons, the stress-strength interference of A related degree showed ${{\theta }_{t}}$ trend of average unabated by considering the effect of dynamic load. The exponential smoothing method is used to predict the timing sequence $\{{{\hat{\theta }}_{{{t}_{j}}}}\}$, and ${{\hat{\theta }}_{{{t}_{d}}}}$ is obtained.
Where $0<a<1$ is the smoothing coefficient, whose value is determined by the least square regression of the sample sequenceand in most cases satisfies $0.05<a<0.3$.
6. Examples
There is a linkage mechanism in a certain machine, which is under tension when working. The tension follows the normal distribution, where themean value and standard deviation are $\overline{F}$=35kN and ${{\sigma }_{F}}$=3.66kN respectively. The material of the linkage mechanism is A5 steel, and its tensile strength follows the normal distribution, where the mean value and standard deviation are 50MPa and 4MPa respectively. The cross-section area of the linkage mechanism is 896mm2. At this situation, we need to analyze the reliability of the linkage mechanism.
The mean and standard deviation of tensile stress of the mechanical linkage are:
$\overline{S}=\frac{\overline{F}}{A}\text{ }=\frac{35\times {{10}^{3}}\text{N}}{896\times {{10}^{-6}}{{\text{m}}^{2}}}=39.1\text{MPa}$
${{\sigma }_{S}}=\frac{{{\sigma }_{F}}}{A}=4.08\text{MPa}$
The correlation structure between tensile stress $S$ and tensile strength $\delta$ conforms to the Clayton model ${{C}_{\theta }}(u, v)={{({{u}^{-\theta }}+{{v}^{-\theta }}-1)}^{-1/\theta }}$. The probability density function and cumulative probability distribution of $S$ are:
The probability density function and cumulative probability distribution of tensile strength $\delta $ are:
Then, by substituting the above two formulas into the stress-strength interference reliability model, the initial reliability R of the mechanical linkage is obtained with the change of the correlation degree parameters $\theta $, as shown in Figure 5.
Figure 5.
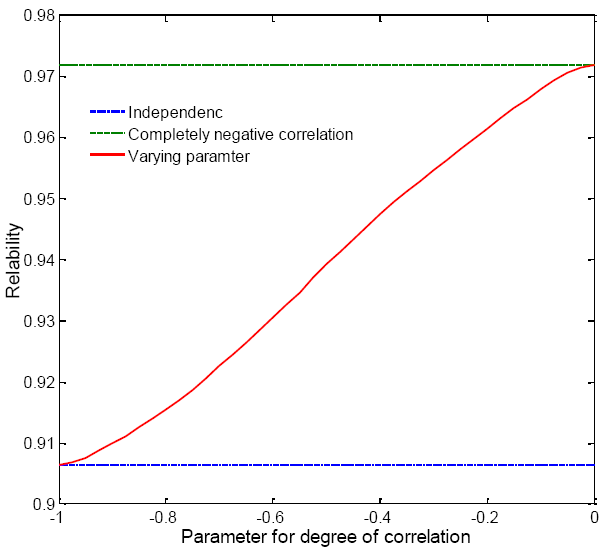
Figure 5.
Time-varying reliability of the mechanical linkage
From Figure 5, it can be seen that the link reliability calculated by stress S and strength $\delta $ correlation interference is between [0.9064, 0.9719], and it is a continuous value changing with the correlation degree parameter $\theta $.
R=0.9064 at the left end of the interval is the reliability value when the stress S and the strength $\delta $ are completely inversely correlated linear functions ($\theta =-1$). If the traditional interference model (10) is adopted according to the independence theory, the reliability is calculated as the right endpoint value of the interval, R=0.9719.
Obviously, the traditional interference model supposes that stress and strength are independent, which tends to open up the calculation results and may lead to overestimation of product reliability.
If the Monte Carlo method is adopted to simulate 4000 times by computer, the simulated sample value is substituted into the maximum likelihood estimation Equation (13), and the correlation degree parameter is obtained as -0.3517. At this point, the correlation structure of stress S and strength $\delta $ is shown in Figure 6, and the reliability of the mechanical linkage can be obtained from (8) of R=0.9512.
Figure 6.
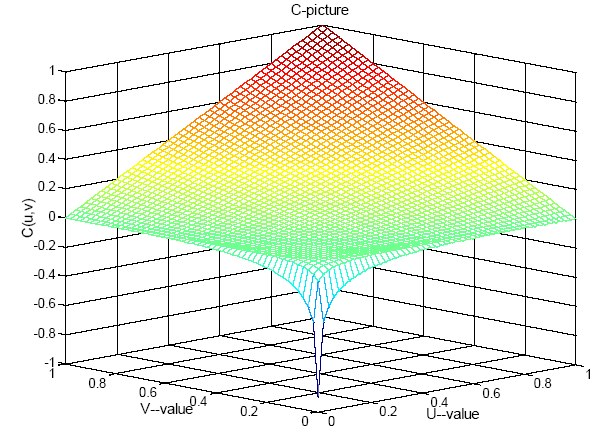
Figure 6.
Stress-strength related structures Clayton copula model when θ = -0.3514
7. Conclusions
The analysis of correlation between stress and strength is the theoretical basis of reliability calculation of mechanical parts. Based on this, the reliability calculation model of stress-strength correlation interference is a generalization of the classical simplified model and becomesmore suitable for practical applications.
The statistical theory of time series is an effective method for reliability analysis of long-life products.Based on the long-life and high mechanical parts performance degradation data using the deterministic trends combined time-series model, the comprehensive stress process of parts dynamic degradation characteristics parameter estimation method can be given. Based on two-stage maximum likelihood estimation, the comprehensive stress and comprehensive strength correlation degree are determined to complete the reliability evaluation of the stress-intensity correlation interference of long-lived parts. However, parameter estimation, correlation structure determination, and distribution prediction are all dependent on statistical analysis and information extraction of performance detection data. In general, the larger the sample size is, the more accurate the calculation results will be. Moreover, compared with the classical simplified model, this model is more computationally intensive.
Reference
“Stress-Strength Reliability Analysis of System with Multiple Types of Components using Survival Signature, ”
DOI:10.1016/j.cam.2018.04.029
URL
[Cited within: 1]

In this paper, we study the estimation for stress–strength reliability of the system with multiple types of components based on survival signature. In the situation that different types of components are subjected to different types of random stresses, the maximum likelihood estimator, maximum spacing estimator, bootstrap-p confidence interval, two point estimators and generalized confidence interval using generalized pivotal quantity for system stress–strength reliability are derived under the assumption that the stresses and strengths variables follow the Gompertz distributions with common or unequal scale parameters. Additionally, when the stresses and strengths variables follow the Gompertz distributions with unequal scale parameters, a modified generalized confidence interval for the system stress–strength reliability based on the Fisher Z Z mathContainer Loading Mathjax transformation is also proposed. In the situation that the system is subjected to the common stress, the above point estimators and confidence intervals for the system stress–strength reliability are also developed. Monte Carlo simulations are performed to compare the performance of these point estimators and confidence intervals. A real data analysis is presented for an illustration of the findings.
“A General Cause based Methodology for Analysis of Common Cause and Dependent Failures in System Risk and Reliability Assessments, ”
“The Safety of Structures, ”
“In Corporation Common-Cause Failures into No Repairable Multi-State-Parallel System Analysis, ”
DOI:10.1109/24.983398
URL

This paper adapts the universal generating function method of multistate system reliability analysis to incorporate common-cause failures (CCF). An implicit 2-stage approach is used. In stage #1, a polynomial representation of system-output performance distribution is obtained without considering system elements which are subject to CCF. In stage #2, the contribution of CCF is correctly included based on information stored in vector-indicators that describe states of system elements belonging to various common-cause groups. A straightforward procedure is suggested for evaluating reliability functions of nonrepairable series-parallel multistate systems with CCF. This procedure allows the reliability functions to be obtained numerically. Examples are given
“An Expert Knowledge-based Dynamic Maintenance Task Assignment Model using Discrete Stress-Strength Interference Theory, ”
DOI:10.1016/j.knosys.2017.06.008
URL
Expert knowledge has become an important factor in optimization decision-making for complex equipment maintenance. Motivated by the challenges of quantifying expert knowledge as a decision basis, we presented an expert knowledge-based dynamic maintenance task assignment model by using discrete stress trength interference (DSSI) theory. We constructed the task assignment framework consisting of three parts: building expert database, selecting experts for tasks, and implementing the tasks, in which selecting experts for tasks based on expert knowledge is the key part of the model. To quantify tacit knowledge (experience) in optimization decision for expert recommendation, experience was defined as a probability, which is relevant to two random variables: quantity of task successfully implemented (strength) and quantity of task failed (stress), and experience is defined as the probability that the former (strength) is larger than the latter (stress). Further, universal generating function (UGF) method was used to calculate the experience, and decision rule was designed for the dynamic maintenance task assignment. The model can help collaborative maintenance platform periodically review experts performances and assign the corresponding task to the most suitable expert at different periods. A case study shows that the proposed model helps not only to achieve rational allocation of expert resources, but to promote positive competition among experts.
“Bayesian Degradation Analysis with Inverse Gaussian Process Models under Time-Varying Degradation Rates, ”
DOI:10.1109/TR.2016.2635149
URL
Degradation observations of modern engineering systems, such as manufacturing systems, turbine engines, and high-speed trains, often demonstrate various patterns of time-varying degradation rates. General degradation process models are mainly introduced for constant degradation rates, which cannot be used for time-varying situations. Moreover, the issue of sparse degradation observations and the problem of evolving degradation observations both are practical challenges for the degradation analysis of modern engineering systems. In this paper, parametric inverse Gaussian process models are proposed to model degradation processes with constant, monotonic, and S-shaped degradation rates, where physical meaning of model parameters for time-varying degradation rates is highlighted. Random effects are incorporated into the degradation process models to model the unit-to-unit variability within product population. A general Bayesian framework is extended to deal with the degradation analysis of sparse degradation observations and evolving observations. An illustrative example derived from the reliability analysis of a heavy-duty machine tool's spindle system is presented, which is characterized as the degradation analysis of sparse degradation observations and evolving observations under time-varying degradation rates.
“System Level Load-Strength Interference based Reliability Modeling of k-out-of n system, ”
DOI:10.1016/j.ress.2003.12.003
URL
[Cited within: 1]
The issue of information loss in the process of system reliability modeling through conventional load–strength interference analysis is discussed first, and the reason why it is impossible to construct dependent system reliability model simply by means of component reliability index is demonstrated. Then, an approach to modeling the reliability of dependent system with common cause failure (CCF) is presented. The approach is based on system-level load–strength interference analysis and a concept of ‘conditional failure probability of component’ as well. With the opinion that load randomness is the direct cause of failure dependence, a discrete type system reliability model is developed via the conditional component failure probability concept. At last, the model's capabilities to estimate system reliability with CCF effect and to predict high multiplicity failure probability based on low multiplicity failure event data are proved.
“A Discrete Stress Strength Interference Model based on Universal Generating Function, ”
DOI:10.1016/j.ress.2007.09.011
URL
[Cited within: 1]
Continuous stress trength interference (SSI) model regards stress and strength as continuous random variables with known probability density function. This, to some extent, results in a limitation of its application. In this paper, stress and strength are treated as discrete random variables, and a discrete SSI model is presented by using the universal generating function (UGF) method. Finally, case studies demonstrate the validity of the discrete model in a variety of circumstances, in which stress and strength can be represented by continuous random variables, discrete random variables, or two groups of experimental data.
“Life Distribution based Degradation Analysis, ”
DOI:10.1109/TR.2004.837519
URL
The methods commonly used for degradation analysis deduce the lifetime distribution of a product from the distribution of the random parameters in the degradation path model for the product. This approach requires a functional form of the joint distribution of the random parameters, which poses certain practical difficulties. In this paper, we propose an alternative approach which makes inference directly on the lifetime distribution itself. In the proposed approach, degradation data are first used to derive predictive intervals of individual lifetimes. Then an imputation algorithm is invoked to obtain the estimate of the lifetime distribution. The approach has the following advantages: 1) the adequacy of the assumption on the lifetime distribution can be easily examined, 2) the estimated lifetime distribution has a closed form, and 3) the procedure can be more easily implemented. A simulation study is reported to demonstrate the efficiency of the proposed approach. The approach is applied to two real degradation data sets, and compared with Lu-Meeker's two stage method in the applications.
“Importance Measures for Optimal Structure in Linear Consecutive-k-out-of-n Systems, ”
“An Alternative Reliability Modeling Approach using Maximum Likehood Estimation, ”
DOI:10.1109/TR.2005.845965
URL
[Cited within: 1]
An alternative degradation reliability modeling approach is presented in this paper. This approach extends the graphical approach used by several authors by considering the natural ordering of performance degradation data using a truncated Weibull distribution. Maximum Likelihood Estimation is used to provide a one-step method to estimate the model's parameters. A closed form expression of the likelihood function is derived for a two-parameter truncated Weibull distribution with time-independent shape parameter. A semi-numerical method is presented for the truncated Weibull distribution with a time-dependent shape parameter. Numerical studies of generated data suggest that the proposed approach provides reasonable estimates even for small sample sizes. The analysis of fatigue data shows that the proposed approach yields a good match of the crack length mean value curve obtained using the path curve approach and better results than those obtained using the graphical approach.
“Optimal Selective Maintenance Decisions for Large Serial k-out-of-n: G Systems under Imperfect Maintenance
”,
DOI:10.1016/j.ress.2018.03.023
URL
[Cited within: 1]
This paper introduces the first SMP model for serial k -out-of- n systems. Two nonlinear formulations are developed, which can be used to solve the problem for small to moderate size k -out-of- n systems. For large k -out-of- n systems or complex reliability structures, we develop a new two-phase approach which transforms the problem into a multidimensional multiple-choice knapsack problem (MMKP). The new approach is shown to be efficient through multiple sets of numerical experiments.
“Reliability Evaluation of the Eurocode Model for Fatigue Assessment of Steel Bridges, ”
“Stress-Strength Reliability Analysis of Multi-State System based on Generalized Survival Signature, ”
DOI:10.1016/j.cam.2018.03.041
URL
The stress–strength model has been widely used in reliability design of system. In the traditional stress–strength reliability theory, the system and each component are assumed to be only in one of two possible states being either working or failed, and the notion of stress–strength reliability is the probability that the strength is larger than the stress. In this paper, we study the stress–strength reliability of multi-state system based on generalized survival signature. It is supposed that the state of multi-state system is defined by using the ratio between strength and stress random variables. The definitions of generalized survival signature for a certain class of multi-state system with multi-state components in both discrete and continuous cases are given. In addition, the expressions of stress–strength reliability in both discrete and continuous situations are derived. In the case of continuous multi-state system, it is assumed that the random strength and stress are both from the Weibull distributions with different scale parameters, and the two different continuous kernel functions are Pareto and generalized half logistic distribution functions, respectively. Based on the assumptions, the stress–strength reliability is estimated by using both classical and Bayesian statistical theory. The uniformly minimum variance unbiased estimator and maximum likelihood estimator for the stress–strength reliability of the continuous multi-state system are derived. Under the squared error loss function, the exact expression of Bayes estimator for the stress–strength reliability of the continuous multi-state system is developed by using Gauss hypergeometric function. Finally, the Monte Carlo simulations are performed to compare the performances of the proposed stress–strength reliability estimators, and a real data set is also analyzed for an illustration of the findings.
“Stress-Strength Interference Reliability Analysis Considering Stochastic Multi-Stress and Strength Aging Degradation, ”
“Reliability Modelling of CNC Machine Tools based on the Improved Maximum Likelihood Estimation Method, ”
“Reliability Bounds based on Universal Generating Function and Discrete Stress-Strength Interference Model, ”
A method for estimating the component reliability is proposed when the probability density functions of stress and strength can not be exactly determined. For two groups of finite experimental data about the stress and strength, an interval statistics method is introduced. The processed results are formulated as two interval-valued random variables and are graphically represented by using two histograms. The lower and upper bounds of component reliability are proposed based on the universal generating function method and are calculated by solving two discrete stress-strength interference models. The graphical calculations of the proposed reliability bounds are presented through a numerical example and the confidence of the proposed reliability bounds is discussed to demonstrate the validity of the proposed method. It is showed that the proposed reliability bounds can undoubtedly bracket the real reliability value. The proposed method extends the exciting universal generating function method and can give an interval estimation of component reliability in the case of lake of sufficient experimental data. An application example is given to illustrate the proposed method.
“Fatigue Reliability Evaluation Model based on Residual Strength Tests of Whole Damage Region, ”
Residual strength is obviously the basis of residual strength model. As a result material residual strength was measured on various damage states.The test data of residual strength was well function expressed. The general form of the residual strength analytical model is put forward and based on it the expression to describe the degradation rule of constant amplitude loading and two block loading is also studied analytically and experimentally. and subsequently approach to analyze the fatigue reliability of material under constant amplitude and two block amplitude loading is given in detail. Two examples have been carried out to demonstrate the validity of the presented model. It is show that the estimation has well correlation with the experiment.
“On the Value of Redundancy Subject to Common-Cause Failures: Toward the Resolution of an on-Going Debate
”,
DOI:10.1016/j.ress.2009.06.007
URL
Common-cause failures (CCF) are one of the more critical and challenging issues for system reliability and risk analyses. Academic interest in modeling CCF, and more broadly in modeling dependent failures, has steadily grown over the years in the number of publications as well as in the sophistication of the analytical tools used. In the past few years, several influential articles have shed doubts on the relevance of redundancy arguing that “redundancy backfires” through common-cause failures, and that the latter dominate unreliability, thus defeating the purpose of redundancy. In this work, we take issue with some of the results of these publications. In their stead, we provide a nuanced perspective on the (contingent) value of redundancy subject to common-cause failures. First, we review the incremental reliability and MTTF provided by redundancy subject to common-cause failures. Second, we introduce the concept and develop the analytics of the “redundancy–relevance boundary”: we propose this redundancy–relevance boundary as a design-aid tool that provides an answer to the following question: what level of redundancy is relevant or advantageous given a varying prevalence of common-cause failures? We investigate the conditions under which different levels of redundancy provide an incremental MTTF over that of the single component in the face of common-cause failures. Recognizing that redundancy comes at a cost, we also conduct a cost–benefit analysis of redundancy subject to common-cause failures, and demonstrate how this analysis modifies the redundancy–relevance boundary. We show how the value of redundancy is contingent on the prevalence of common-cause failures, the redundancy level considered, and the monadic cost–benefit ratio. Finally we argue that general unqualified criticism of redundancy is misguided, and efforts are better spent for example on understanding and mitigating the potential sources of common-cause failures rather than deriding the concept of redundancy in system design.
“Reliability Demonstration for Long-Life Products based on Degradation Testing and a Wiener Process Model, ”
DOI:10.1109/TR.2014.2315938
URL
In this paper, the degradation based reliability demonstration test (RDT) plan design problems for long life products under a small sample circumstance are studied. Fixed sample method, sequential probability ratio test (SPRT) method, and sequential Bayesian decision method are provided based on univariate degradation testing. The simulation examples show the superiority of degradation based RDT methods compared with the traditional failure based methods, and the sequential-type methods have more test power than their fixed sample counterparts. The test power can be further improved by combining the test data of a reliability indicator with the data of its marker, based on which the bivariate fixed sample method and the sequential Bayesian decision method are defined. The simulation study shows the benefit from the combination. The degradation based RDT plan optimization model, and the corresponding searching-based solution algorithm using some heuristic rules discovered in the paper, are also presented. The case study of Rubidium Atomic Frequency Standard with a RDT plan design demonstrates the effectiveness of our methods on overcoming the difficulties of small samples in reliability demonstration of long life products.
“Dispersion Entropy: A Measure for Time-Series Analysis, ”
DOI:10.1109/LSP.2016.2542881
URL
Multiscale entropy (MSE) is an appealing tool to characterize the complexity of time series over multiple temporal scales. Recent developments in the field have tried to extend the MSE technique in different ways. Building on these trends, we propose the so-called refined composite multivariate multiscale fuzzy entropy (RCmvMFE) whose coarse-graining step uses variance (RCmvMFE 2) or mean... [Show full abstract]
“Upper &Lower Bounds of Stress-Strength Interference Reliability with Random Strength Degradation, ”
“Evaluation of Fatigue Damage Model Predictions for Fixed Offshore Wind Turbine Support Structures, ”
DOI:10.1016/j.ijfatigue.2016.01.007
URL
This work deals with the evaluation of the spectral fatigue damage prediction of a tripod offshore wind turbine support structure subjected to combined stochastic wave and wind – induced loads. The stochastic loadings are defined using the sea states based on a scatter diagram related to the North Atlantic. Further, the power spectral density of the hot spot stress is estimated accordingly. The prediction of fatigue damage is evaluated in several spectral fatigue damage models including the Rayleigh, Wirsching–Light, Tunna, α0.75, Tovo and Benasciutti, Zhao–Baker, Rice and Dirlik models. Critical hot spot locations, which experience the most fatigue damage, are analysed based on the finite element method and theS–Nfatigue damage approach. The time-domain solution based on the rainflow cycle counting method is assumed to be the “real” data and the model that best fits the fatigue damage of the wind turbine support structure is identified with the Akaike’s Information Criterion.
“A New Class of Copulas Involved Geometric Distribution: Estimation and Applications, ”
DOI:10.1016/j.insmatheco.2015.09.008
URL
[Cited within: 1]
Copula is becoming a popular tool for modeling the dependence structure among multiple variables. Commonly used copulas are Gaussian, tand Gumbel copulas. To further generalize these copulas, a new class of copulas, referred to as geometric copulas, is introduced by adding geometric distribution into the existing copulas. The interior-point penalty function algorithm is proposed to obtain maximum likelihood estimation of the parameters of geometric copulas. Simulation studies are carried out to evaluate the efficiency of the proposed method. The proposed estimation method is illustrated with workers compensation insurance data and exchange rate series data.
“Mechanical Design and Analysis of Direct-Plated-Copper AluminumNitride Substrates for Enhancing Thermal Reliability, ”
DOI:10.1016/j.microrel.2015.08.010
URL
[Cited within: 2]
Highlights 61 To resolve crack problem of DPC AlN substrate during thermal cycling and provide parameters for good thermal reliability. 61 To show the hysteresis and Bauschinger-like behaviors for a Cu-AlN bi-material plate under the solder reflow. 61 To find out Cu-film wedge angle, length, and thickness significantly affect the maximum stress of AlN during thermal cycling. 61 The predicted failure mode and location based on the maximum 1st principal stress of AlN is consistent with experiment. 61 The nonlinear property of Cu-film can dramatically lower the maximum 1st principal stresses of AlN. Abstract Direct-plated-copper (DPC) aluminum nitride (AlN) substrate with a high thermal conductivity can provide a good alternative to conventional aluminum oxide (Al2O3) substrate for better heat dissipation in the high-power module applications. However, the DPC AlN substrate suffers AlN crack initiating at the edge corner of Cu film during thermal cycling, due to the higher thermal expansion coefficient mismatch with copper material. This study is to resolve the AlN crack problem of DPC AlN substrate during thermal cycling and further to provide important parameters for mechanical design for ensuring good thermal reliability. Prior to the analysis, the out-of-plane deformation measurement of a Cu-AlN bi-material plate subject to the solder reflow heating and cooling is conducted for evaluating the material property of the plated Cu film and residual stresses induced from the manufacturing and solder reflow process. The results show the hysteresis and Bauschinger-like behaviors for the Cu-AlN plate during the solder-reflow heating and cooling. It is also found from the validated finite element simulation that the Cu-film wedge angle, length, and thickness significantly affect the maximum 1st principal stress of AlN during thermal cyclic loading, and the predicted failure mode and location based on the maximum 1st principal stress is consistent with experimental observation. The other factors, such as single-side and double-side Cu-film (sandwich-structure-alike) substrates, length difference of Cu films, and the nonlinear property of Cu film will be presented and discussed in detail as well.
“Calculation and Updating of Common Cause Failure Unavailability by using Alpha Factor Model, ”
DOI:10.1016/j.anucene.2015.12.004
URL
[Cited within: 1]
The most lethal role of Common Cause Failures (CCFs), which motivate the experts to investigate it, is the dependent behavior therein contained, which leads to simultaneous failure of the systems. Highly redundant systems are more susceptible to be affected by CCFs and also CCFs have been recognized as the principal contributor in the terrestrial reactor accidents. In the past, plenty of work has been done regarding the calculation of unavailability of different types of systems due to CCFs by using different techniques such as fault tree analysis (FTA). But the qualitative aspects such as human errors, maintenance faults and poor components quality cannot be updated by using FTA as the changes occur. So in order to overcome this problem, multinomial distribution function and its conjugate Dirichlet distribution function has been used as likelihood and prior, respectively, in Bayes theorem to obtain an updated posterior function of the same form as Dirichlet distribution function thus improving the working and monitoring capability of Probabilistic Safety Assessment (PSA). Furthermore, the presented research highlights a mathematical model to estimate system unavailability due to CCF by using alpha factor model. By using this model, we can calculate failure probability (unavailability) of the systems quite accurately through the two parameters kandQt. The ease of using the proposed model can be assessed through the brief analysis of a case study of Auxiliary Feed Water System (AFWS). AFWS is used in all designs of Pressurized Water Reactor (PWR). It plays a vital role in maintaining a heat sink by providing feedwater to the steam generators.
“Maximum-Likelihood Estimation of Parameters of NHPP Software Reliability Models using Expectation Conditional Maximization Algorithm, ”
DOI:10.1109/TR.2016.2570557
URL
[Cited within: 1]
Since its introduction in 1977, the expectation maximization (EM) algorithm has been one of the most important and widely used estimation method in estimating parameters of distributions in the presence of incomplete information. In this paper, a variant of the EM algorithm, the expectation conditional maximization (ECM) algorithm, is introduced for the first time and it provides a promising alternative in estimating the parameters of nonhomogeneous poisson (NHPP) software reliability growth models (SRGM). This algorithm circumvents the difficult M-step of the EM algorithm by replacing it by a series of conditional maximization steps. The utility of the ECM approach is demonstrated in the estimation of parameters of several well-known models for both time domain and time interval software failure data. Numerical examples with real-data indicate that the ECM algorithm performs well in estimating parameters of NHPP SRGM with complex mean value functions and can produce a faster rate of convergence.
