


1. Introduction
State monitoring of rotating machines has attracted much attention in recent years, and the detection of structural changes in the machine state has been a long-standing problem in this area [1-3]. This technique can provide an indication for possible failures or unexpected/undesired operation behaviors at an early stage so as to prevent potential failures and improve equipment/product reliability, safety, and quality, as well as productivity in industries [4]. For the purpose of extracting machine state information, the vibration signal is widely employed for its superiority in data collection and its quick interpretation/response as changes occur [5-7].
Most methods to analyze the vibration signal are either frequency-domain or time-domain based. However, although frequency-domain analysis based on Fourier transform has been widely employed in many dialogistic applications, a fatal defect of this method is that it is time-consuming in computation [8], which is not suitable for real-time prognostic applications especially when the system needs to make a response or take appropriate actions as soon as possible as an unexpected/undesired change occurs. Moreover, when the machinery operates in a lower or non-stationary state, the detection based on frequency-domain is inaccurate [9]. As a result, existing approaches for change detection are based on time-domain analysis [10-12].
In general, time-domain analysis based change detection includes two steps: feature extraction and change decision making. In particular, feature extraction plays an important role in the design of detection algorithms and thus directly influences final results [13]. Existing time-domain features such as root mean square (RMS), crest factor, standard deviation (SD), mean square error (MSE), and variance only consider the amplitude of the signal; thus, they are easily affected by noise. As a result, some efforts have been made to extract more reliable and accurate features by taking into account the structural/ordering information in the data from [14-16].
Inspired by these works, this paper presents a new high-level feature for vibration signal analysis based on correlograms. The correlogram has been widely adopted in many fields, such as quality control [17] and image processing [18], and it has been demonstrated to be effective in the structural analysis/expression of data [19]. To the best of our knowledge scope, this is the first attempt using it to extract features in the analysis of machine vibration signals. As shown in Figure 1, the proposed method includes two steps: learning process and testing process. In the learning process, the codebook is formed from training data where the codewords are generated using a clustering algorithm, typically the k-means algorithm. In the testing process, for a given data stream collected from a rotating machine, the correlogram is computed in each cycle by comparing every data point in the cycle with all codewords firstly; the entropy [20] is then computed from the correlogram to form the high-level feature to measure the state of the machine. We applied the proposed feature method to speed change monitoring based on an experimental setup used in our previous work and compared it with ten typical features in detection performance. Experimental results demonstrated its effectiveness and priority over other features for comparison.
Figure 1.
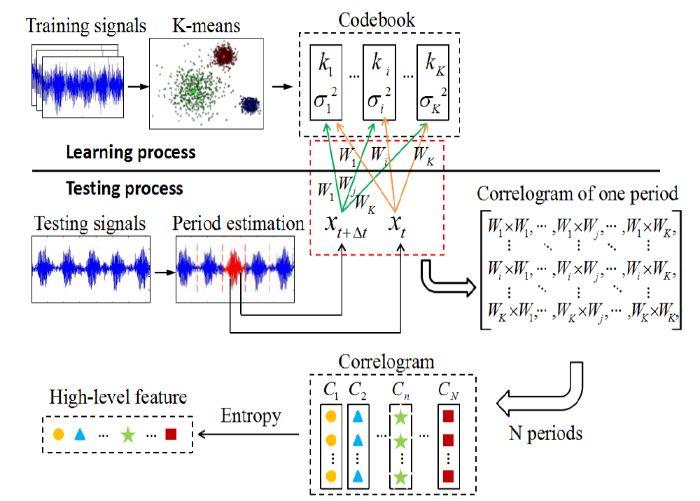
Figure 1.
Schematic diagram of the high-level feature extraction based oncorrelogram
Moreover, in this paper, Section 1 gives a brief introduction about this paper; next, a method of high-level feature extraction is described in Section 2. Section 3 introduces a method of change decision making to estimate the feature extraction method. In Section 4, we provide the experimental results. Finally, some conclusions are given in Section 5.
2. Methodology
2.1. Correlogram Calculation
Given a time series of vibration signals $\chi =\{{{x}_{z}}\},\text{ }z=1, 2,\cdots , Z$, where Z is the length of the time series, we firstly assume that it has been divided into individual cycles. Then, the data stream can be denoted by $\chi =\left\{ {{X}_{1}},\cdots ,{{X}_{n}},\cdots ,{{X}_{N}} \right\}$ where ${{X}_{n}}$ represents the data ofthe ${{n}^{\text{th}}}$ cycle and N is the total number of cycles. In particular, for each cycle, the data can be denoted by ${{X}_{n}}=\left\{ {{x}_{t}} \right\},\text{ }t=\left\{ 1, 2,\cdots , T \right\}$, whereTis the period length and ${{x}_{t}}$ is the numerical value of the vibration signal at t. The element of the correlogram in the ${{n}^{\text{th}}}$ cycle can be calculated by
Where $\Delta t$ indicates the time offset and $Wi, t$ is the projection of the ${{t}^{\text{th}}}$ data point in the current ${{n}^{\text{th}}}$ period to a specific adopted kernel that is computed as a distance between the data and the kernel. In this paper, we adopt the Gaussian kernel function to obtain $Wi, t$ because it has good robustness, and $Wi, t$ is calculated by
where $\{ki,\sigma {{i}^{2}}\}$ is the ${{i}^{\text{th}}}$ codeword in a pre-designed codebook, which can be obtained through clustering pre-collected training samples using a clustering algorithm (the details of codeword generation will be presented in the following section), and K is the size of codebook. As shown in Figure 2, for each pair ofdata in the ${{n}^{\text{th}}}$ cycle with time interval $\Delta t$, we can calculate ${{W}_{i}}$ and ${{W}_{j}}$. Based on this, the correlogram can be constructed in which each element in it is the multiplication of ${{W}_{i}}$ and ${{W}_{j}}$, which are the projections of data in the ${{n}^{\text{th}}}$ cycle to the ${{i}^{\text{th}}}$ and ${{j}^{\text{th}}}$ codewords, respectively. Finally, for each cycle of vibration data, we can now represent them with a correlogram with a size of $K\times K$, and subsequently the whole time series of vibration signal$\chi $ can be represented by a time series of resulting correlograms, i.e.,$\chi =\{{{C}_{1}},\cdots ,{{C}_{n}},\cdots {{C}_{N}}\}$, where ${{C}_{n}}$ is the correlogram corresponding to the ${{n}^{\text{th}}}$cycle.
Figure 2.
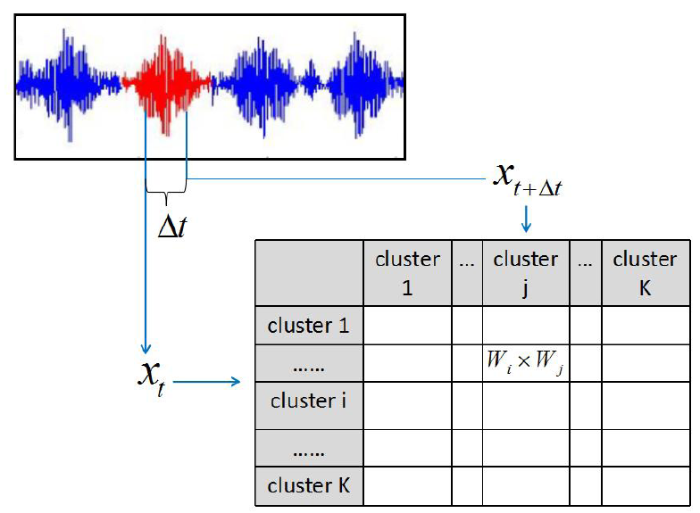
Figure 2.
Illustration of construction of a correlogram
2.2. Codebook Generation
As mentioned in the above section, construction of the correlogram depends on a pre-designed codebook that is composed of a series of codewords. For this purpose, a k-mean based clustering algorithm is adopted to generate the codebook, which is performed as follows:
$\cdot$ Collection of sufficient vibration signals from a monitoring rotating machine as the training samples;
$\cdot$ Performing the k-means algorithm on all training samples, and as such, the resulting clustering centers along with their corresponding standard deviations, i.e., $\{ki,\sigma {{i}^{2}}\},\text{ }i=1, 2,\cdots , K$ are considered as the codewords to compose the codebook.
Moreover, it is noted that the cluster number K has great influence on the clustering results [21]. More specifically, when the value of K is small, the robustness of the codebook to noise will be high, but the computation resolution to the feature extraction will meanwhile decrease; similarly, when the value of K is larger, the computation resolution will increase, but the robustness will deteriorate. It is difficult to automatically determine the K value, and thus it is generally determined by a prior estimation or the experience of the user. In this paper, we use a prior estimation to confirm the value of K compatible with our application.
2.3. High-Level Feature Extraction based on Correlogram
Based on the correlograms calculated in Section 2.1, a high-level feature is extracted in this section. The entropy is used to extract the state of the machine from the resulting correlograms. Specifically, for the correlogram of the ${{n}^{\text{th}}}$cycle, i.e., ${{C}_{n}}$, the entropy is calculated by
Where q is a constant corresponding to a choice of measurement units and ${{p}_{mn}}$ represents the proportion of the ${{m}^{\text{th}}}$ element of the correlogram of the ${{n}^{\text{th}}}$ cycle. They are calculated respectively as follows:
where ${{c}_{n}}\left( i, j;\Delta t \right)$ is the element of the correlogram of the ${{n}^{\text{th}}}$ cycle.
Coupling with these formulations, a high-level feature is finally extracted. Note that as a cycle-level feature, the high-level feature has two essential merits compared with the data-point level features (such as kurtosis, skewness, variance, etc.): (1) the proposed feature has high computational efficiency since it is now computed in a cycle-by-cycle way instead of point-by-point; (2) it is believed to have a better robustness to noise since we employ the projections of vibration signals to codebook instead of original data values.
In summary, the proposed feature can be obtained as follows: for a given data stream X, as seen in Figure 3(a), for example, we firstly represent it as a time-series of correlograms using the method of Section 2.1 (refer to Figure 3(b)), and then we use the entropy to extract the final features from these time-sequential correlograms for the purpose of extraction of the state of the monitoring machine state, as seen in Figure 3(c).
Figure 3.
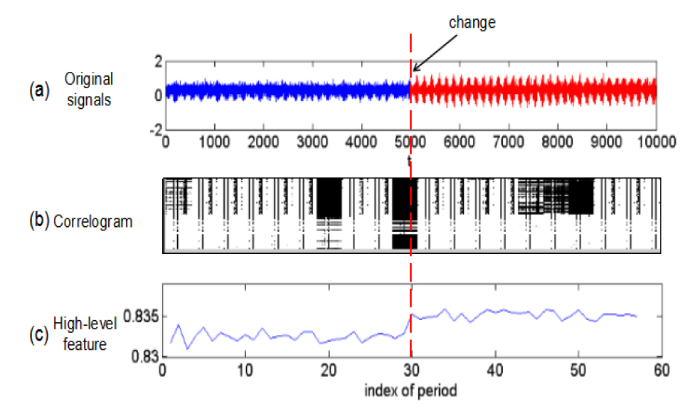
Figure 3.
High-level feature extraction based on correlogram by using entropy
3. Change Decision Making
Based on the final resulting features, appropriate change detection tests can be performed to make change decisions. The existing methods can be divided into two groups: retrospective detection and real-time detection. Generally, retrospective detections such as the likelihood ratio test (LRT) [22], Hellinger distance [23], and Kullback-Leibler Divergence (K-L Divergence) [24] accommodate applications that allow certain delays, while real-time detection targets applications require immediate responses.
As for the state monitoring problems studied in this paper, since it is expected that the system obtains the result as soon as possible after a change occurs, we use the real-time detection method in this paper. More specifically, we use the $3\sigma '$ control chart for inspecting whether a change occurs at the current ${{n}^{th}}$ cycle. The corresponding hypothesis testing is given as follows:
where ${{H}_{0}}$ Means that no change occurs on the ${{n}^{\text{th}}}$ cycleas long as $\left| {{s}_{n}}-\overline{s} \right|<3{\sigma }'$, and ${{H}_{1}}$ denotes that a change occurs when $\left| {{s}_{n}}-\overline{s} \right|\ge 3{\sigma }'$. Here,$\{\overline{s},{\sigma }'\}$ is the representation of assumed Gaussian distribution, where $\overline{s}$ is the mean of the distribution and ${\sigma }'$ is the standard deviation, which can be calculated as below:
4. Experiment
4.1. Implementation
We applied the proposed feature to speed change monitoring based on an experimental setup as shown in Figure 4. Vibration signal was firstly collected by sensor mounted on the gearbox and then sent to PC. During the data collection, we first set the initial system speed as $v$ and then changed it to $\Delta v$ to simulate a change. With this setting, we can obtain the vibration signal as the testing data. The testing values of $v$ and $\Delta v$ are given as follows:
Figure 4.
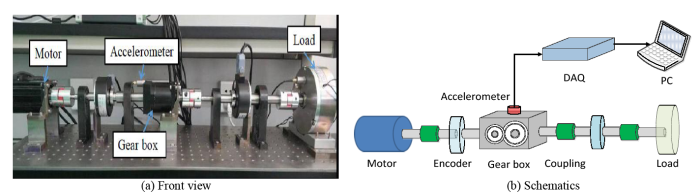
Figure 4.
Experimental setup for the collection of testing data
On top of this, we have 15 parameter combinations with different speed changes as shown in Table 1, and for each combination, testing data were collected at five times. Finally, we formed our testing database including a total number of 75 testing signals.
Table 1. Simulated change of $v\to \Delta v$
| $\Delta v\backslash v$ | 250 | 300 | 350 |
|---|---|---|---|
| 50 | 250→250+50 | 300→300+50 | 350→350+50 |
| 100 | 250→250+100 | 300→300+100 | 350→350+100 |
| 150 | 250→250+150 | 300→300+150 | 350→350+150 |
| 200 | 250→250+200 | 300→300+200 | 350→350+200 |
| 250 | 250→250+250 | 300→300+250 | 350→350+250 |
To verify the effectiveness of our proposed extracted feature, three common indicators of precision, recall, and ${{F}_{1}}$ are employed and are calculated as
where $u$ represents the number of true changes, ${{u}_{1}}$ is the number of changes detected, and ${{u}_{2}}$ is the number of changes that are correctly detected. The accuracy of the detection can be reflected in the precision, and the ability of detecting all change points can be reflected in the recall. ${{F}_{1}}$ is a composite indicator that considers both precision and recall.
4.2. Result and Analysis
Since the time offset $\Delta t$and the cluster number K can greatly influence our proposed feature extraction method, we tested three values of $\Delta t$, i.e., $\Delta t$=3, 5, 7, and values of K from 20 to 80 with an interval of 10 for feature extraction. Notice from Figure 5, when $\Delta t$= 5, ${{F}_{1}}$ is the highest, which indicates the feature extraction method has achieved the best performance. The main reason is that a smaller value of $\Delta t$ will lead to less robustness to local noise, whilea larger value of K will result in lower computation resolution for the resulting features. In other words, when $\Delta t$= 5, the proposed method can achieve the best balance between robustness and computation resolution for the features computed by our method.
Figure 5.
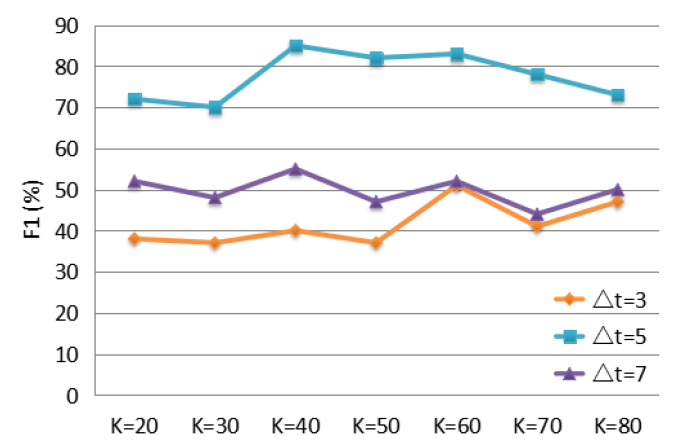
Figure 5.
Detection results for different values of $\Delta t$
To further investigate the influence of K, we provide the detailed results of different Kvalues for $\Delta t$=5. From Figure 6, it can be seen that the overall detection performance in terms of precision and recall increases with an increasing value of K before K =40 but decreases subsequently. A clearer observation can be found in the term of ${{F}_{1}}$ where the proposed method achieves the best performance, i.e., ${{F}_{1}}$=85% when K=40. The main reason of these observations is the argument stated in Section 2.2, that is, K can affect the final detection results.
Figure 6.
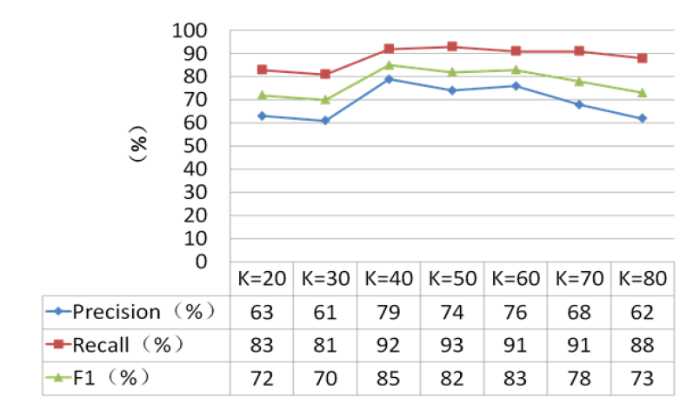
Figure 6.
Detection results for different values of K with $\Delta t$=5
Furthermore, to evaluate the priority of our method, the proposed feature is compared with ten typical features used in vibration signal analysis: RMS, crest factor, kurtosis, waveform, skewness, quadratic mean (QM), SD, MSE, variance, and maximum peak (MP), which are shown in Table 2. For these features, we perform the same hypothesis testing in Equation(6) to detect possible changes in each testing data.
Table 2. Computation of selected ten typical features
| Features | Formulations |
|---|---|
| RMS | ${{X}_{RMS}}=\sqrt{\frac{\sum\limits_{z=1}^{Z}{{{x}_{z}}^{2}}}{Z}}$ |
| Crest factor | ${{X}_{C}}=\frac{\left| {{x}_{z}} \right|}{{{X}_{RMS}}}$ |
| Kurtosis | ${{X}_{K}}=\frac{1}{Z}\sum\limits_{z=1}^{Z}{{{(\frac{{{x}_{z}}-\overline{x}}{{{X}_{SD}}})}^{4}}}$ |
| Waveform | ${{X}_{W}}=\frac{{{X}_{RMS}}}{\frac{1}{Z}\sum\limits_{z=1}^{Z}{\left| {{x}_{z}} \right|}}$ |
| Skewness | ${{X}_{SK}}=\frac{Z\sum\limits_{z=1}^{Z}{{{({{x}_{z}}-\overline{x})}^{3}}}}{(Z-1)(Z-2){{X}_{SD}}^{3}}$ |
| Mean | $\overline{x}=\frac{1}{Z}\sum\limits_{z=1}^{Z}{{{x}_{z}}}$ |
| SD | ${{X}_{SD}}=\sqrt{\frac{1}{Z}\sum\limits_{z=1}^{Z}{{{({{x}_{z}}-\overline{x})}^{2}}}}$ |
| MSE | $MSE=\frac{1}{Z}\sum\limits_{z=1}^{Z}{{{\varepsilon }_{z}}^{2}},{{\varepsilon }_{z}}=observe{{d}_{z}}-predicte{{d}_{z}}$ |
| Variance | ${{X}_{V}}=\frac{1}{Z}\sum\limits_{z=1}^{Z}{{{({{x}_{z}}-\overline{x})}^{2}}}$ |
| MP | ${{X}_{MP}}=\max ({{x}_{z}})$ |
Here, it is worth mentioning that since the proposed method has demonstrated the best performance when $\Delta t$=5 and K=40, we compared this result with those by the compared features. Figure 7 give two examples of change detection with different speed change by using our method as well as other methods, where from top to bottom are the testing data, the detection results by the proposed feature, as well as the detection results obtained by the compared features. In particular, we used the red cycles for denoting the detected change points for each method. Some conclusions are summarized as below: (1) by using the proposed features, changes can be detected successfully and accurately without any false alarm; (2) for the compared features, including RMS, waveform, skewness, mean, SD, MSE, variance, and MP, changes can be detected successfully, but there are many false alarms as shown in the figure; (3) for other features, such as kurtosis and crest factor, changes cannot be detected successfully but many false alarms have been reported. These observations demonstrate the effectiveness and the priority of our feature over ten compared features.
Figure 7.
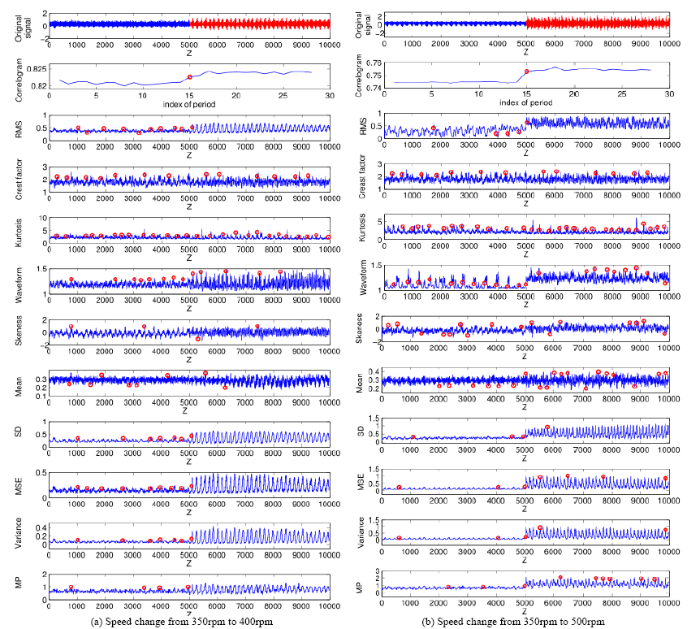
Figure 7.
Two examples of the detection results by our proposed feature as well as using ten compared features
Moreover, a comprehensive comparison is provided in Figure 8 for all testing data, where for each compared feature, we count all the changes in a period as a change point for giving a fair comparison with our method, considering our method gives the cycle-level detection as mentioned in Section 2.3. On this basis, three indicators of the high-level feature based on our method as well as the compared features are calculated. Here, note that our proposed features achieved the best detection performance in all terms of the three indicators clearly.
Figure 8.
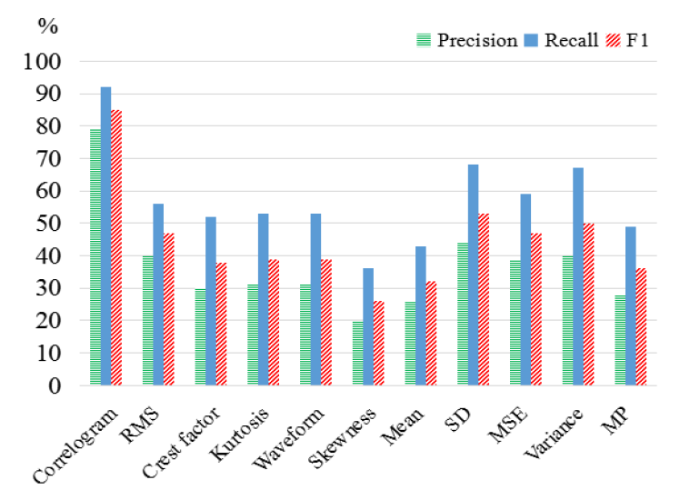
Figure 8.
Three indicators for evaluating the methods of feature extraction
In summary, from the above experiments, the proposed feature has shown its potential in real engineering applications.
5. Conclusions
In this paper, a high-level feature extraction method is proposed based on correlograms for vibration signal analysis. In the method, as a pre-processing, the codebook is firstly created from training data using ak-means algorithm. In the testing process, for a given data stream collected from a monitoring rotating machine, the correlogram of each cycle is calculated by comparing every data point with all codewords in the codebook, and the entropy is calculated to form the final features to represent the state of the machine. Based on the final resulting features, hypothesis testing is performed to detect potential changes in the machine state. As shown by the experiment results, the proposed feature demonstrates excellent detection performance that outperforms ten compared typical feature methods, suggesting its potential in real engineering applications.
In future works, we will focus on further optimizing the computation method to achieve higher computational efficiency.
Acknowledgements
This work is supported by the Young Scholars Program of Shandong University (YSP-SDU).
Reference
“The Vibration Monitoring Methods and Signal Processing Techniques for Structural Health Monitoring: A Review, ”
DOI:10.1007/s11831-015-9145-0
URL
[Cited within: 1]

Machines without vibrations in the working environment are something non-existent. During machining operations, these vibrations are directly linked to problems in systems having rotating or reciprocating parts, such as bearings, engines, gear boxes, shafts, turbines and motors. Vibration analysis has proved to be a measure for any cause of inaccuracy in manufacturing processes and components or any maintenance decisions related to the machine. The non-contact measurement of vibration signal is very important for reliable structural health monitoring for quality assurance, optimizing profitability of products and services, to enhance manufacturing productivity and to reduce regular periodic inspections. This paper presents a state-of-the-art review of recent vibration monitoring methods and signal processing techniques for structural health monitoring in manufacturing operations. These methods and techniques are used as a tool to acquire, visualize and analyse the sampled data collected in any machining operation which can then be used for decision making about maintenance strategies.
“A Novel Framework of Change-Point Detection for Machine Monitoring, ”
DOI:10.1016/j.ymssp.2016.06.030
URL

61A new method of periodicity estimation is proposed based on Dynamic Time Warping.61A new computation method is proposed to measure anomalies in a given time series.61The potential change is detected by a new statistical test based on martingale.
“Detection of Structural Changes through Principal Component Analysis and Multivariate Statistical Inference, ”
DOI:10.1177/1475921715624504
URL
[Cited within: 1]
This article introduces a new methodology for the detection of structural changes using a statistical data-driven modeling approach by means of a distributed piezoelectric active sensor network at different actuation phases. The three main features that characterize the proposed methodology are (a) the nature of the data used in the test since vectors of principal component analysis projections are used instead of the entire measured response of the structure or the coefficients of an AutoRegressive model, (b) the number of data used since the test is based on two random samples instead of some characteristic indicators, and (c) the samples come from a multidimensional variable and therefore a test for the plausibility of a value for a normal population mean vector is performed. The framework of multivariate statistical inference is used with the objective of the classification of structures in healthy or damaged. The novel scheme for damage detection presented in this article ased on multivariate inference over the principal component analysis projections of the raw data s applied, validated, and tested on a small aluminum plate. The results show that the presented methodology is able to accurately detect damages, that is, for each actuation phase, a unique and reliable damage detection indicator is obtained no matter the number of sensors and/or actuators. It is worth noting that a major contribution of this article is that there exists an entire range of significance levels where the multivariate statistical inference is able to offer a correct decision although all of the univariate tests make a wrong decision.
“Detection of Faults in Rotating Machinery using Periodic Time-Frequency Sparsity, ”
DOI:10.1016/j.jsv.2016.07.004
URL
[Cited within: 1]
Abstract: This paper addresses the problem of extracting periodic oscillatory features in vibration sig- nals for detecting faults in rotating machinery. To extract the feature, we propose an approach in the short-time Fourier transform (STFT) domain where the periodic oscillatory feature man- ifests itself as a relatively sparse grid. To estimate the sparse grid, we formulate an optimization problem using customized binary weights in the regularizer, where the weights are formulated to promote periodicity. In order to solve the proposed optimization problem, we develop an algorithm called augmented Lagrangian majorization-minimization algorithm, which combines the split augmented Lagrangian shrinkage algorithm (SALSA) with majorization-minimization (MM), and is guaranteed to converge for both convex and non-convex formulation. As examples, the proposed approach is applied to simulated data, and used as a tool for diagnosing faults in bearings and gearboxes for real data, and compared to some state-of-the-art methods. The results show the proposed approach can effectively detect and extract the periodical oscillatory features.
“Multi-Stage Feature Selection by using Genetic Algorithms for Fault Diagnosis in Gearboxes based on Vibration Signal, ”
DOI:10.3390/s150923903
URL
PMID:4610427
[Cited within: 1]
Fault diagnosis is important for the maintenance of rotating machinery. The detection of faults and fault patterns is a challenging part of machinery fault diagnosis. To tackle this problem, a model for deep statistical feature learning from vibration measurements of rotating machinery is presented in this paper. Vibration sensor signals collected from rotating mechanical systems are... [Show full abstract]
“Rolling Bearing Diagnosing Method based on Empirical Mode Decomposition of Machine Vibration Signal, ”
DOI:10.1016/j.apacoust.2013.09.001
URL
Rolling bearing faults are one of the major reasons for breakdown of industrial machinery and bearing diagnosing is one of the most important topics in machine condition monitoring. The main problem in industrial application of bearing vibration diagnostics is the masking of informative bearing signal by machine noise. The vibration signal of the rolling bearing is often covered or concealed by other structural vibrations sources, such as gears. Although a number of vibration diagnostic techniques have been developed over the last several years, in many cases these methods are quite complicated in use or only effective at later stages of damage development. This paper presents an EMD-based rolling bearing diagnosing method that shows potential for bearing damage detection at a much earlier stage of damage development. By using EMD a raw vibration signal is decomposed into a number of Intrinsic Mode Functions (IMFs). Then, a new method of IMFs aggregation into three Combined Mode Functions (CMFs) is applied and finally the vibration signal is divided into three parts of signal: noise-only part, signal-only part and trend-only part. To further bearing fault-related feature extraction from resultant signals, the spectral analysis of the empirically determined local amplitude is used. To validate the proposed method, raw vibration signals generated by complex mechanical systems employed in the industry (driving units of belt conveyors), including normal and fault bearing vibration data, are used in two case studies. The results show that the proposed rolling bearing diagnosing method can identify bearing faults at early stages of their development.
“Graph-based Structural Change Detection for Rotating Machinery Monitoring, ”
DOI:10.1016/j.ymssp.2017.06.003
URL
[Cited within: 1]
Detection of structural changes is critically important in operational monitoring of a rotating machine. This paper presents a novel framework for this purpose, where a graph model for data modeling is adopted to represent/capture statistical dynamics in machine operations. Meanwhile we develop a numerical method for computing temporal anomalies in the constructed graphs. The martingale-test method is employed for the change detection when making decisions on possible structural changes, where excellent performance is demonstrated outperforming exciting results such as the autoregressive-integrated-moving average (ARIMA) model. Comprehensive experimental results indicate good potentials of the proposed algorithm in various engineering applications. This work is an extension of a recent result (Lu et al., 2017).
“Probabilistic Frequency-Domain Discrete Wavelet Transform for Better Detection of Bearing Faults in Induction Motors, ”
DOI:10.1016/j.neucom.2015.06.100
URL
[Cited within: 1]
Due to the importance of induction motors’ continuous operation, early detection of faults has become a major trend. As reported in an IEEE study, bearing failures include more than half of mechanical faults. To detect existence of this fault, methods such as (short-time) Fourier, (continuous–discrete) wavelet, and Park transforms introduced. Static modeling of fault behavior is determined to be the major deficiency of above-mentioned methods. In other words, using conventional detection techniques, fault is assumed to have deterministic behavior, in which the fault frequencies are constant. As a matter of fact, fault characteristics can be affected under loading or environmental conditions, which makes conventional standing invalid. Authors of this paper have developed their previously introduced technique, frequency-domain discrete wavelet transform (FD-DWT) into a stochastic model. This makes the detection process valid for more variety of fault conditions and leads to earlier detection of fault and less damage to motor compared to other strategies.
“Vibration Signal Analysis using Parameterized Time-Frequency Method for Features Extraction of Varying-Speed Rotary Machinery, ”
DOI:10.1016/j.jsv.2014.09.025
URL
[Cited within: 1]
In real application, when rotary machinery frequently involves variable-speed, unsteady load and defect, it will produce non-stationary vibration signal. Such signal can be characterized by mono- or multi-component frequency modulation (FM) and its internal instantaneous patterns are closely related to operation condition of the rotary machinery. For example, instantaneous frequency (IF) and instantaneous amplitude (IA) of a non-stationary signal are two important time–frequency features to be inspected. For vibration signal analysis of the rotary machinery, time–frequency analysis (TFA), known for analyzing the signal in the time and frequency domain simultaneously, has been accepted as a key signal processing tool. Particularly, parameterized TFA, among various TFAs, has shown great potential to investigate time–frequency features of non-stationary signals. It attracts more attention for improving time–frequency representation (TFR) with signal-dependent transform parameters. However, the parameter estimation and component separation are two problems to tackle with while using the parameterized TFA to extract time–frequency features from non-stationary vibration signal of varying-speed rotary machinery. In this paper, we propose a procedure for the parameterized TFA to analyze the non-stationary vibration signal of varying-speed rotary machinery. It basically includes four steps: initialization, estimation of transform parameter, component separation and parameterized TFA, as well as feature extraction. To demonstrate the effectiveness of the proposed method in analyzing mono- and multi-component signals, it is first used to analyze the vibration response of a laboratory rotor during a speed-up and run-down process, and then extract the instantaneous time–frequency signatures of a hydro-turbine rotor in a hydroelectric power station during a shut-down stage. In addition, the results are compared with several traditional TFAs and the proposed method outperforms others in accurate feature extraction, which is promising in applications of fault detection, system condition monitoring, parameter identification, etc.
“Feature Denoising and Nearest-Farthest Distance Preserving Projection for Machine Fault Diagnosis, ”
DOI:10.1109/TII.2015.2475219
URL
[Cited within: 1]
It is a big challenge to identify the most effective features for enhancement of fault classification accuracy in rotating machines due to nonstationary and nonlinear vibration characteristics of the machines under varying operating conditions. To find discriminative features, a novel dimension reduction algorithm, referred to as the nearest and farthest distance preserving projection (NFDPP), is proposed for machine fault feature extraction and classification. With the NFDPP, both the nearest and farthest samples of the data manifold can be analyzed simultaneously to identify features leading to fault classification. Additionally, we denoise the features directly in the feature space to save computation time and storage space, and prove its equivalence to denoising the signals in the time domain. Through analysis of measured vibration data for bearings with different defects, it is demonstrated that the proposed NFDPP approach can effectively classify different bearing faults and identify the severity of the bearing ball defect, and the direct denoising of features yield a significant improvement in fault classification. The effectiveness of the proposed method is further validated in identifying compound faults in locomotive bearings in an industrial setting.
“Detection of Partial Demagnetization Fault in PMSMs Operating under Nonstationary Conditions, ”
DOI:10.1109/TMAG.2015.2511003
URL
Demagnetization fault detection of in-service permanent magnet synchronous machines (PMSMs) is a challenging task, because most PMSMs operate under nonstationary circumstances in industrial applications. A novel approach based on tracking characteristic orders of stator current using Vold-Kalman filter is proposed to detect the partial demagnetization fault in PMSMs running at nonstationary conditions. The amplitude of envelope of the fault characteristic orders is used as fault indictor. Experimental results verify the superiority of the proposed method on the partial demagnetization online fault detection of PMSMs under various speed and load conditions.
“A Novel Bearing Fault Diagnosis Model Integrated Permutation Entropy, Ensemble Empirical Mode Decomposition and Optimized SVM, ”
DOI:10.1016/j.measurement.2015.03.017
URL
[Cited within: 1]
This paper presents a novel hybrid model for fault detection and classification of motor bearing. In the proposed model, permutation entropy (PE) of the vibration signal is calculated to detect the malfunctions of the bearing. If the bearing has faults, the vibration signal is decomposed into a set of intrinsic mode functions (IMFs) by ensemble empirical mode decomposition (EEMD). The PE values of the first several IMFs (IMF-PE) are calculate to reveal the multi-scale intrinsic characteristics of the vibration signal. Then, support vector machines (SVM) optimized by inter-cluster distance (ICD) in the feature space (ICDSVM) is used to classify the fault type as well as fault severity. Finally, the proposed model is fully evaluated by experiments and comparative studies. The results demonstrate its effectiveness and robustness for motor bearing fault detection and classification.
“Fault Feature Extraction of Rolling Element Bearings using Sparse Representation, ”
DOI:10.1016/j.jsv.2015.12.020
URL
[Cited within: 1]
61A bearing fault diagnosis method using sparse representation is proposed.61Rolling element sliding and other time varying factors are taken into consideration.61The dictionary parameters are directly identified from bearing fault signal.61The fault impulses are reconstructed by segments.61The method is confirmed through simulation and experimental results.
“Automatic Fault Feature Extraction of Mechanical Anomaly on Induction Motor Bearing using Ensemble Super-Wavelet Transform, ”
DOI:10.1016/j.ymssp.2014.09.007
URL
[Cited within: 1]
61Using TQWT in feature extraction of motor bearing07s early weak fault.61A fault feature ratio is defined based on Hilbert transform.61An ensemble super-wavelet transform for fault feature extraction is proposed.61Effectiveness of ESW is verified via numerical simulations.61ESW is applied to two engineering applications to verify its effectiveness.
“Feature Extraction using Adaptive Multiwavelets and Synthetic Detection Index for Rotor Fault Diagnosis of Rotating Machinery, ”
DOI:10.1016/j.ymssp.2014.07.024
URL
http://linkinghub.elsevier.com/retrieve/pii/S0888327014003148
“Fault Diagnosis of Rotating Machinery with a Novel Statistical Feature Extraction and Evaluation Method, ”
DOI:10.1016/j.ymssp.2014.05.034
URL
[Cited within: 1]
61Statistical features approximating normal distributions are extracted.61Performance of ANN and SVM based fault classifiers is significantly improved.61Statistical features are evaluated for fault classification with simple algebraic computations.61Accuracy of fault classification is analytically guaranteed.
“Monitoring Quality of Biotherapeutic Products using Multivariate Data Analysis, ”
DOI:10.1208/s12248-016-9908-z
URL
PMID:27044370
[Cited within: 1]
Abstract Monitoring the quality of pharmaceutical products is a global challenge, heightened by the implications of letting subquality drugs come to the market on public safety. Regulatory agencies do their due diligence at the time of approval as per their prescribed regulations. However, product quality needs to be monitored post-approval as well to ensure patient safety throughout the product life cycle. This is particularly complicated for biotechnology-based therapeutics where seemingly minor changes in process and/or raw material attributes have been shown to have a significant effect on clinical safety and efficacy of the product. This article provides a perspective on the topic of monitoring the quality of biotech therapeutics. In the backdrop of challenges faced by the regulatory agencies, the potential use of multivariate data analysis as a tool for effective monitoring has been proposed. Case studies using data from several insulin biosimilars have been used to illustrate the key concepts.
“Trademark Image Retrieval using Weighted Combination of Sift and HSV Correlogram, ”
DOI:10.1504/IJCAT.2016.077797
URL
[Cited within: 1]
This paper proposes a trademark retrieval algorithm combining the image global features and local features. Firstly, extract pseudo Zernike moments of the retrieved image and sort them according to similarity. Candidate images are formed. Then, the SIFT features are used for matching the query image accurately with candidate images. Experimental results show that this method not only keeps... [Show full abstract]
“Dimensionality Reduction-based Feature Extraction and Classification on Fleece Fabric Images, ”
Signal,
“Application of Wavelet Energy and Shannon Entropy for Feature Extraction in Gearbox Fault Detection under Varying Speed Conditions, ”
DOI:10.1016/j.neucom.2013.12.018
URL
[Cited within: 1]
61In this paper, to process the non-stationary vibration signals, the re-sampling technique at constant angle increment is combined with the continuous wavelet transform.61The key idea is to select the optimal range of wavelet scales based on the maximum energy to the Shannon entropy ratio criteria.61Energy and Shannon entropy of the wavelet coefficients are used as two new features along with other statistical parameters as input of the classifier.61A feed-forward multilayer perceptron (MLP) neural network uses the extracted features for classification.
“Cluster Analysis, ”
“Wavelet-based Analysis of Mode Shapes for Statistical Detection and Localization of Damage in Beams using Likelihood Ratio Test, ”
DOI:10.1016/j.engstruct.2016.11.056
URL
[Cited within: 1]
This paper presents a case study on statistical procedures for the detection and localization of damage along a beam. Tests are performed on a specially designed beam consisting of an assembly of three bolted sections under laboratory conditions to simulate various levels of incremental damage at two possible locations along the beam. Incremental damage is simulated by sequentially removing plate elements at each location. In this work, damage detection algorithms are tested to detect low levels of incremental damage which is usually challenging given the high noise to signal ratio. The beam is tested for two end restraint conditions, pinned-pinned and fixed-fixed. The detection algorithm combines various statistical techniques with a wavelet-based vibration damage detection method to improve the detection of low levels of incremental damage and further proposes a novel likelihood-based approach for the localization of damage along the beam. A Continuous Wavelet Transform (CWT) analysis is applied to the first mode of vibration of the beam obtained from a set of 16 equally spaced unidirectional accelerometers measuring dynamic acceleration response of the beam. A Principal Component Analysis (PCA) is performed on the wavelet coefficients in order to extract the main patterns of variation of the coefficients and to filter out noise. The scores of the first principal component are shown to be highly correlated with damage levels as demonstrated by statistical tests on changes on the location parameter of the scores in successive damage states. Given that statistically significant damage is detected, a Likelihood Ratio (LR) test is proposed to determine the most likely location of incremental damage along the beam. The results indicate that the algorithm is very efficient to detect damage at multiple locations and for the two end restraint conditions investigated.
“The Hellinger Distance in Multicriteria Decision Making: An Illustration to the TOPSIS and TODIM Methods, ”
“Quickest Change Detection and Kullback-Leibler Divergence for Two-State Hidden Markov Models, ”
DOI:10.1109/ISIT.2015.7282433
URL
[Cited within: 1]
of the HMM involves a real-valued nuisance parameter. Finally, our research provides an alternative approach that can numerically compute the Kullback-Leibler (KL) divergence of two-state HMMs via the invariant probability measure and the Fredholm integral equation.
