


1. Introduction
The vital components of complex machinery and electronics products, as the core of the whole product architecture, play an important role in the fields of product quality, reliability, and maintenance [1]. As is well-known, the highly defective design parameters (DPs) of components will directly affect product quality, and the DPs of the vital components should be attached to the importance of product reliability [2]. The process of product failure is a dynamically changing process. The failure of vital components can accelerate this process, because the vital components can spread the failure information to other components [3]. Furthermore, the key customer requirements (CRs) are always related to the vital components, and how to transfer CRs to the function requirements (FRs) is a meaningful research topic [4]. Motivated by those descriptions, research on the vital (key) components has a significant effect on the improvement of product reliability and customer satisfaction degree.
However, it is challenging to identify those vital components from the complex machinery and electronics products that include numerous components. Many practical problems are similar to this issue. For instance, the vital spreaders in social networks should be identified to spread the information quickly [5]. Moreover, the immunization of large-degree nodes, which are usually considered more influential entities, is a highly efficient method to control the epidemic spreading [6-7]. To control the spread of diseases, identifying and controlling the key dissemination source can effectively prevent further spreading of the virus [8]. Searching for drug-target candidates in anti-infectious and anti-cancer therapies can benefit from determining the vital proteins [9]. Similarly, the quality and reliability of complex machinery and electronics products can be dramatically improved by identifying the vital components at the design stage of new products.
Recently, most research has focused on identifying the vital DPs, FRs, and other important design elements in the redesign process [4]. For example, Karsak [10] proposed an integrated fuzzy linear-programming approach to prioritize DPs. Similarly, Chen and Ko [11] determined the fulfillment levels of FRs and part characteristics by combining the quality function development (QFD) and failure mode and effect analysis (FMEA) into a fuzzy linear-programming model. Chang and Cheng [12] focused on identifying the influential causes of failure and assigning limited resources to serious risk items through a decision-making trial in an evaluation laboratory. Ma et al. [1] introduced an improved component-identification method, which combined QFD and FEMA to consider both the fuzziness of CRs and the failure risk of components. These studies were conducted to support product redesign rather than new product development, which is considered in this study. In the recent decade, with the continuous development of the theory of complex networks, it has constantly been applied in various aspects of product development and has achieved huge success. The main applications include product family modeling [13], product module partition [14], design change propagation [15], and searching important design elements in R&D groups [16].
In this regard, a novel approach based on complex networks is proposed to identify the vital components of complex machinery and electronics product at the design stage. Firstly, the pre-determined components and relationships between them are mapped into a weighted and directed complex network (WDCN) model. Second, a LeaderRank algorithm [17] is modified to determine the vital components. Finally, the effects of the vital components are verified by a SIR model [18]. The vital components for a complex electric blower are identified as a case study to verify the effectiveness of the proposed method.
2. Literature Review
Since some related research works on identifying vital design parameters has been reviewed in Section 1, this section will focus on the method of identifying vital nodes in complex networks, especially on algorithms and their applications in engineering design.
The identification of vital individuals is very significant in many fields of society, as it allows us to better understand and utilize the structure and function of various systems [19]. In the marketing field, many issues include locating advertisements and making commercial profit for e-commercial products closely rely on the identification of vital online users [5]. To facilitate the flow of information, Chen et al. studied the issue of influence maximization wherein the social networks would be significantly affected by activating several vital individuals [20]. Some studies also have been conducted on identifying vital nodes to prevent catastrophic outages in power grids or global cascade of overload failures in the internet [21]. Furthermore, Radicchi selected the best player from the records of professional sport competitions by using complex networks [22]. Successful scientists as well as popular scientific publications can also be predicted based on co-authorship and citation networks [23-24]. Based on the above research, it can be seen that identifying vital design elements (such as the FRs, DPs, and components) to guarantee the quality and reliability of products is critical in the area of product development. The Design Structure Matrix (DSM) is a remarkable tool in the field of product development because it can solve a number of complex and difficult design problems. Browning represented a DSM-based method to solve the system decomposition and integration problem [25]. To better manage the current engineering activities, Yassine and Braha introduced a standardized DSM model to implement concurrent engineering in the development projects of complex products [26]. In order to speed up the product design efficiency, Tang et al. introduced an integrated approach based on DSM that can capture, organize, and reuse product design knowledge [27]. Fu et al. proposed a DSM-based probabilistic model that can evaluate the risk of change propagation and avoid unnecessary redesigns [28]. Nevertheless, research on DSM-based approaches to identify vital design elements is rare in existing literature.
Identifying the vital nodes in complex networks is an important research topic and can help people identify the vital elements in various systems [29]. Lv et al. summarized the state of the art on this subject [19]. Chen et al. mentioned that the simplest method to find the vital nodes in networks is to count the number of neighbor nodes; this method is called degree centrality [20]. Chen et al. proposed a new method called theLocalRank algorithm to improve the degree centrality algorithm [29]. However, the above research neglected the local interconnectedness that negatively affects the information-spreading networks. Hence, an algorithm referred to as ClusterRank is proposed to perfect the accuracy of the above methods and considers both the number of immediate neighbors and clustering coefficient of a node [20]. However, these methods are only focused on the undirected networks, while the relationship between the elements in the real world is usually directed. Brin and Page introduced a method called PageRank to evaluate the importance of web pages, and it helps effectively identify the vital nodes in directed networks [30]. Nevertheless, this algorithm requires a parameter to ensure the existence of the solutions when dangling nodes appear in the networks. To decrease the influence due to the change in parameter for the final results, Lv et al. presented an algorithm termed LeaderRank [31]. It is parameter-free and outperforms PageRank in terms of ranking effectiveness as well as robustness against manipulations and noisy data.
The network-based identification of vital nodes has also been used in engineering design. In order to predict the failures of software, Pinzger et al. compared several centrality metrics, including degree centrality, closeness centrality, and betweenness centrality [32]. The variant of LeaderRank was used to determine the developer’s priority, and it is also effective for the prediction of reopened bugs [33]. Li et al. used the weighted LeaderRank algorithm to find the influential function modules in complex products and systems, and the SIR model was used to verify the correctness of the method [34]. Identifying the vital nodes in complex networks has not been applied to the reliability modeling of complex mechanical and electronics products.
Motivated by the above discussion, this article combined the identification of vital nodes in complex networks and reliability modeling to improve the quality and reliability of the complex mechatronic products.
3. Complex Networks and Susceptible-Infected-Recovered Model
3.1. Complex Networks
A complex network can be represented as a graph G = (V, E), where the elements of $\text{V}=({{v}_{1}},\ {{v}_{2}},\ \cdots \ ,{{v}_{n}})$ are the vertices and the elements of $\text{E}=({{e}_{1}},\ {{e}_{2}},\ \cdots \ ,\ {{e}_{m}})$ are the links, which are used to link the vertices. A simple network model is depicted in Figure 1. Complex networks can be divided into four types, including undirected and unweighted networks, undirected and weighted networks, directed and unweighted networks, and directed and weighted networks.
Figure 1.
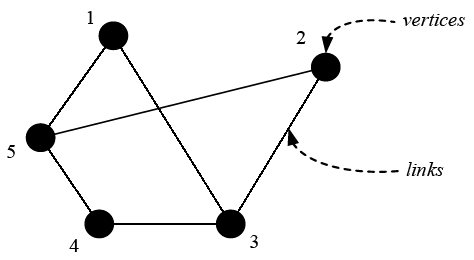
Figure 1.
A simple network model
The above networks can be expressed as an adjacency matrix with n × n elements (nbeing the number of nodes). The elements of the adjacency matrix can be defined as follows:
If a complex network is undirected, the adjacency matrix A is symmetric (i.e., A = AT). For a directed complex network, A is usually unsymmetrical.
3.2. Random Walk Process in the Directed Complex Network
In a directed complex network, a random-walk process is defined as the probability that a random walker on node i moves toward node j in the next random step. The elements of the transition matrix obtained from random-walk are described as follows:
Where ${{w}_{ij}}$ is the element of the adjacency matrix in the directed network.Generally, the random-walk process can be modeled using a Markov chain. After randomly walking for a sufficiently long time, the probability that the random walker is at a specific node i (represented as ${{\pi }_{i}}$) does not change over time.
3.3. Susceptible-Infected-Recovered Model
The SIR model is one of the most classical models in the research field of epidemics, in which “S” represents “susceptible”, “I” represents “infected”, and “R” represents “recovered”. In the SIR model, the population are divided into three categories. The “susceptible (S)” are the healthy people who are susceptible to the disease. The “infected (I)” are the people infected with an infectious disease who can spread the disease to the susceptible. The “recovered (R)” are the people who have recovered from the infectious disease and will not be infected again. In the social network, if an infected person has frequent social behaviors, then this person can accelerate the spread of the disease; however, if one person has few social behaviors, then this person may decelerate the diffusion of the disease.
Thus, in the mathematical model, an individual will be infected to measure the influence of this individual, because an individual who has huge influence can cause many people to get infected. Based on the above viewpoints, in the field of information communication and social networking, the SIR model is often the standard tool used to measure the importance or key degree of an individual [31].Yang et al. [18] considered the reality of the spread of virus and made some improvements on the SIR model, making the model better and scientific in measuring importance degree of nodes. This study will also use this model to measure the importance degree of vital components of complex machinery and electronics products. A simplified network-based SIR model is as shown in Figure 2. At one moment, the infected can infect the susceptible with a certain probability “$\beta $” (such as nodes 1 to 3), and the infected can also become the recovered with a certain probability “$\gamma $” (such as nodes 1 to 4). The spread process of the disease will end when there are none infected in the network (all the infected have become the recovered).
Figure 2.
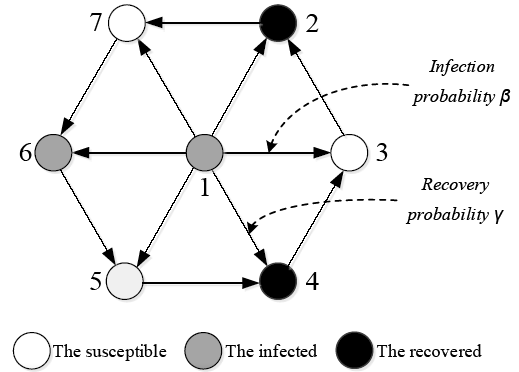
Figure 2.
Schematic diagram of SIR model infection based on network
4. Modeling
A methodology framework has been proposed to solve the identification of the vital components within complex machinery and electronics products, as shown in Figure 3. This framework includes three steps:
Figure 3.
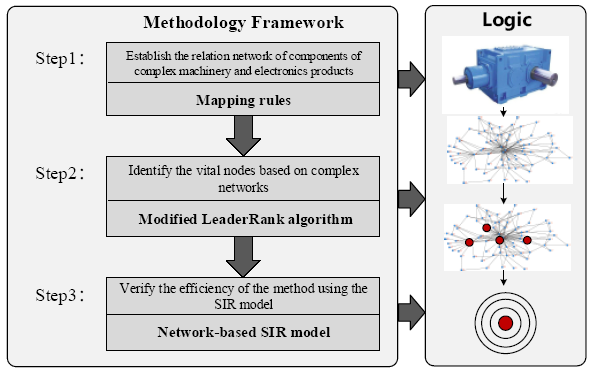
Figure 3.
Methodology framework
Step 1 Establish the relation network of the components within complex machinery and electronics products according to the relationships between components.
Step 2 Identify the vital nodes in complex networks using the LeaderRank algorithm, where the vital nodes represent the vital components.
Step 3 Verify the efficiency of the method proposed in this study by using the network-based SIR model.
4.1. Establish the Relation Network of Components of Complex Machinery and Electronics Products
Modeling a scientific and reasonable relation network for components of complex machinery and electronics products lays a key foundation for the identification of vital components. Based on this, three mapping rules are given as follows: (1) the components of products are mapped into the nodes in complex networks; (2) the relationships between components are mapped into the edges in complex networks; (3) the comprehensive weights of the relationships are mapped into the weights of edges in networks.
The physical relationship between components of complex machinery and electronics products mainly includes connection types and geometric position. Accordingly, two aforementioned physical relationships are emphatically considered in the process of modeling the relation network of components. The types of these two physical relationships and their weights in network modeling, as shown in Table 1 and Table 2, are determined by the expert scoring method. In order to obtain the comprehensive importance of the relation between components, the various physical relations between the components need to be merged to determine the importance of the correlation. The calculation formula of the comprehensive importance of the relationship between components is as follows:
Table 1. Connection type and weight between components
| Connection type | Weight | Connection type | Weight |
|---|---|---|---|
| Electronic linkage | 9 | Bearing connection | 9 |
| Pin connection | 5 | Screw fastening | 5 |
| Threaded connection | 5 | Buckles connection | 3 |
| Slip connection | 1 | Gearing connection | 1 |
| Shaft lock connection | 1 | No connection | 0 |
Table 2. Geometric position and weight between components
| Geometric position | Weight | Geometric position | Weight |
|---|---|---|---|
| Contain | 9 | Surface contact | 5 |
| Line contact | 3 | Point contact | 1 |
| No contact | 0 |
Where ${{E}_{ij}}$ represents the importance degree of the relationship between component i and component j, ${{w}_{kij}}$ represents the weight of the kth(k=1, 2) physical relationship between componentsi and component j, and ${{w}_{k}}$ represents relative weight of the kth(k=1, 2) physical relationship. The weightsw1 and w2are 2/3 and 1/3 respectively through the expert scoring method.
4.2. Identify the Vital Nodes based on the Complex Networks
The PageRank is a classical algorithm utilized to identify vital nodes in directed networks. However, the ranking effectiveness and robustness against manipulations and noisy data of this algorithm change with the change in the parameters [17]. To solve this issue, Lv et al. [31] devised an adaptive and parameter-free algorithm termed LeaderRank. They proved that LeaderRank outperforms PageRank in terms of ranking effectiveness, as well as robustness against manipulations and noisy data. Compared to PageRank, a ground node connecting to every node through bidirectional links (see Figure 4 for illustration) is added into the network with N nodes and M directed edges in the LeaderRank algorithm. Thus, the network becomes a strongly connected network comprising (N + 1) nodes and (M + 2N) directed edges. At this time, the transition matrix obtained through the random-walk process does not need to be corrected unlike PageRank, which adds a parameter. Because dangling nodes do not exist in the network, LeaderRank is termed as a parameter-free algorithm.
Figure 4.
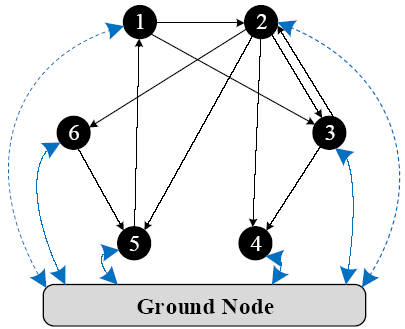
Figure 4.
Illustration of the addition of ground node
Moreover, LeaderRank is an adaptive algorithm. In the PageRank algorithm, the probability that a user does not follow the hyperlink and rather opens a webpage randomly in the webpage network is a constant, which is usually equal to 0.15. However, the probability that the webpages with minority hyperlinks leads to the opening of a new webpage randomly through a ground node is higher than the webpages with majority hyperlinks in the LeaderRank algorithm. LeaderRank is closer to the actual situation, which can adjust the probability of visiting new webpages automatically based on the difference in the degrees of the nodes. This mechanism is referred to as the adaptivity of LeaderRank in this study. This adaptivity can be used to effectively improve the stability of the ranking and robustness of the algorithm [31].Considering Figure 4 as an example, the flow diagram of the LeaderRank algorithm is demonstrated in Figure 5, and the specific steps are as follows:
Figure 5.
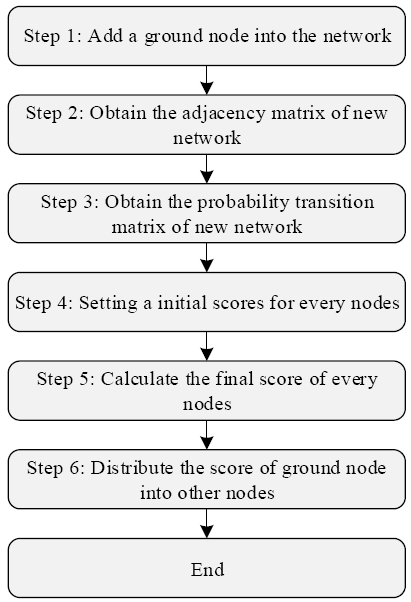
Figure 5.
Flow diagram of LeaderRank algorithm
Step 1 A ground node is added into the network illustrated in Figure 4.
Step 2 The adjacent matrix Aof the new network is obtained by Equation(1).
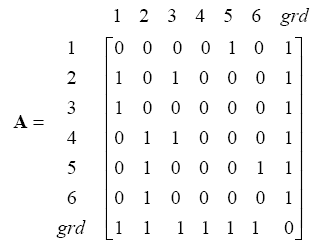
Where node grd represents the ground node.
Step 3 The transition matrix P of the new network is obtained by Equation(2).
Step 4 Assume that all the initial scores of nodes are equal to 1/n except the ground node, where n is the number of nodes in the initial network. The initial score of the ground node is equal to 0. Assume ${{\text{ }\!\!\pi\!\!\text{ }}^{\text{T}}}$ is the stationary row vector of P and the initial value of ${{\text{ }\!\!\pi\!\!\text{ }}^{\text{T}}}$ is equal to the initial score of nodes. Then, proceed to the next step.
Step 5 The relationship of ${{\text{ }\!\!\pi\!\!\text{ }}^{\text{T}}}$ and Pcan be expressed as Equation (6), and the elements of ${{\text{ }\!\!\pi\!\!\text{ }}^{\text{T}}}$ will be stationary after a longstanding iteration as the matrix P is a Markov transition matrix. The final score of nodes is equal to the final value of elements in
Step 6 The score of the ground node is averagely assigned to the other nodes when ${{\text{ }\!\!\pi\!\!\text{ }}^{\text{T}}}$ achieves convergence. The final score of each node is termed the leadership score L, which is defined as follows:
Where ${{\pi }_{i}}$ and ${{\pi }_{grd}}$ are the elements of πT at the stea.dy state. Clearly, the nodes with a higher LeaderRank score will be more vital in the network [31]. For the network shown in Figure 4, the LeaderRank scores of all nodes are obtained: L = (1.043, 1.083, 0.894, 1.033, 1.103, 0.844).
4.3. Verify the Efficiency of the Method using SIR Model
The components often fail due to wear, fracture, and corrosion. The failure has a certain probability spread to other components and causes them to fail. By analogy, a component failure may cause a cascading failure. In addition, a certain failure component also has a certain probability to become a scrapped component, and then the scrapped component does not deliver the failure or accept the failure transmission. This process is similar to the spread of disease, and the failure information is similar to the disease. Based on the above analysis, this paper uses the SIR model to verify the efficiency of the identification of vital components. The main steps are as follows:(1) Select the network nodes represented by key parts or non-critical parts for disease infection.(2) Measure the comprehensive influence of a network node by running a network-based SIR model, which is represented by the total number of network nodes infected by the selected node.(3) If the vital nodes obtained by the algorithm are consistent with the results detected by the network-based SIR model, the validity and correctness of the method can be explained.
5. Case Study
In order to verify the effectiveness of the proposed method in this study, the complex electric blower (see Figure 6) is selected as a case study to identify the vital components in this product.
Figure 6.
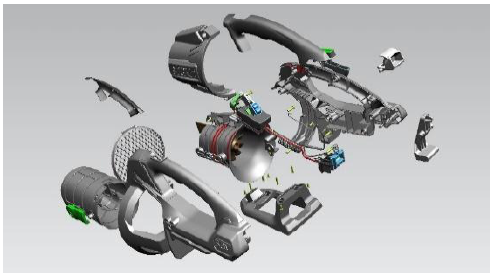
Figure 6.
Complex electric blower
5.1. Establish the Relation Network of the Components of Complex Electric Blower
Figure 7.
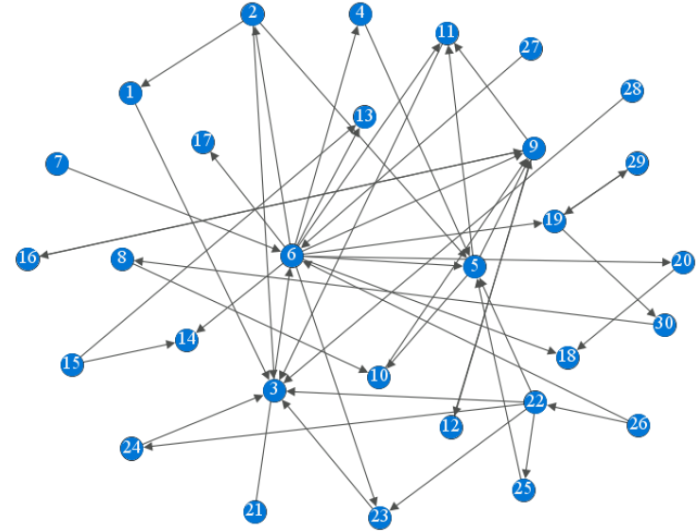
Figure 7.
WDCNs of the components of complex electric blower
Table 3. Components of complex electric blower
| Node | Component | Node | Component |
|---|---|---|---|
| 1 | Rubber ring 1 | 16 | Zoom button |
| 2 | Left casing protector | 17 | Lever |
| 3 | Movement | 18 | The trigger |
| 4 | Wire rack | 19 | Power connector |
| 5 | Channel components | 20 | Trigger spring |
| 6 | Left casing | 21 | Right hand |
| 7 | Left hand | 22 | Right casing |
| 8 | Capacitance | 23 | Ventilation network |
| 9 | PCBS | 24 | Rubber ring 2 |
| 10 | Conductor | 25 | Right chassis cover |
| 11 | Heat-shrinkable tube R1 | 26 | The base |
| 12 | Speed dial button | 27 | Hooks |
| 13 | Release button | 28 | Ram |
| 14 | Battery locking buckle | 29 | Battery pack |
| 15 | Battery pack latch spring | 30 | Heat contraction tube R2 |
5.2. Identify the Vital Nodes in Network based on the LeaderRank Algorithm
The LeaderRank algorithm introduced in Section 3.2 is implemented with a console application of Visual Studio 2017® on a computer with the following specifications: Intel (R) Core TM i-5-5200U CPU at 2.20 GHz, 4.0 GB of RAM, and Windows 8.1. In Figure 8, the final LeaderRank (LR) scores of the nodes are obtained. Table 4 lists the scores. From Figure 8 and Table 4, the vital nodes in the complex network of components are obtained, that is, 3, 9, 11, 6, 5, and 10, respectively corresponding to the movement, PCBS, heat-shrinkable tube R1, left casing, channel components, and conductor as the vital components.
Figure 8.
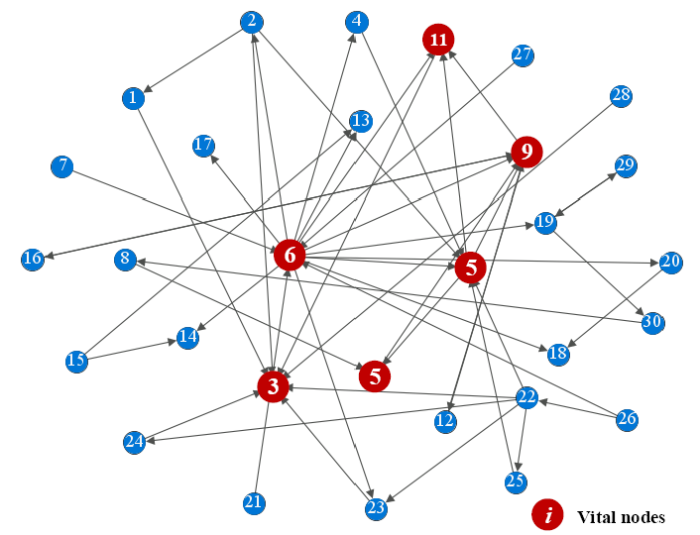
Figure 8.
Vital nodes in the relation network of components
Table 4. LeaderRank score of nodes in network
| Node | LeaderRank Score | Node | LeaderRank Score |
|---|---|---|---|
| 3 | 2.411425(Top 20%) | 23 | 0.829938 |
| 9 | 2.253546 (Top 20%) | 22 | 0.798697 |
| 11 | 1.465628 (Top 20%) | 1 | 0.787491 |
| 6 | 1.312145 (Top 20%) | 24 | 0.760664 |
| 5 | 1.278074 (Top 20%) | 25 | 0.760664 |
| 10 | 1.233537 (Top 20%) | 2 | 0.753872 |
| 12 | 1.162409 | 4 | 0.753872 |
| 16 | 1.162409 | 15 | 0.753872 |
| 19 | 1.041566 | 17 | 0.753872 |
| 8 | 0.972291 | 20 | 0.753872 |
| 18 | 0.959659 | 7 | 0.684597 |
| 29 | 0.917686 | 21 | 0.684597 |
| 30 | 0.917686 | 26 | 0.684597 |
| 13 | 0.891063 | 27 | 0.684597 |
| 14 | 0.891063 | 28 | 0.684597 |
5.3. Verify theEfficiency of the Proposed Method based on SIR Model
In order to evaluate the effectiveness of the LeaderRank algorithm, the solution results of the algorithm are tested by the SIR model. The vital nodes (top 20%) of 3, 11, and 10 and non-vital nodes of 29 and 21 are selected to compare the influence of those nodes in the whole product and then prove the validity of the method. By running the program, the results of the comparative analysis are obtained, as shown in Figure 9.
Figure 9.
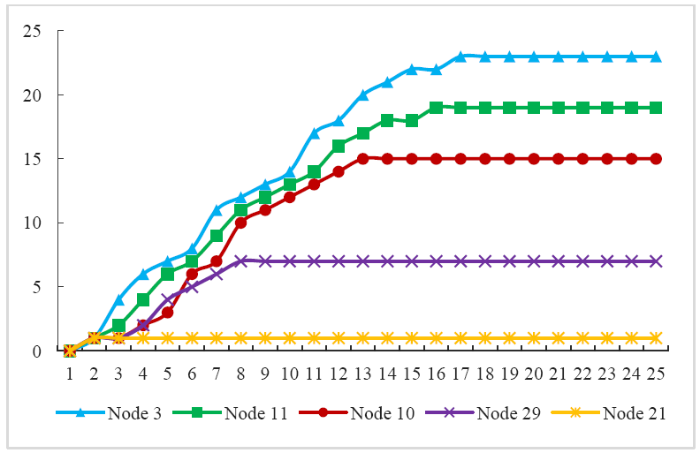
Figure 9.
Influence comparison for the vital components with different LR scores
It can be seen that the result of the identification of vital components using the SIR model is the same as the result using the method proposed. Namely, the larger the LeaderRank value of the network node, the greater the influence of the node. Through the validation of the SIR model, the effectiveness and correctness of the proposed method in identifying vital components of complex machinery and electronics products are illustrated.
Furthermore, from the perspective of engineering reliability, the vital components of the movement, PCBS, heat-shrinkable tube R1, left casing, channel components, and conductor are the easiest wear components in the complex electric blower products. If those vital components turn to failure, that failure information can lead to a widespread failure in the entire product. Therefore, these components can be regarded as the vital components of the complex electric blower. During the product design or manufacturing process, these vital components should be focused on to avoid uncontrollable design changes. The identification of vital components can improve product reliability and extend the service life of products.
6. Conclusions
A method based on complex networks for the identification of vital components in complex machinery and electronics products is proposed in this study. This method considers both the connection types of components and the geometry position of two factors. Firstly, the WDCNs of the relationships between components is established, and then the LeaderRank algorithm is used to identify vital nodes of complex network. Finally, the proposed method is applied for identifying the vital components of the complex electric blower. The result indicates that the proposed method is effective and reliable. Furthermore, the proposed method also has advantages of low computational complexity and high computational efficiency. The final results can provide important basis for product design changes, product reliability improvement, and manufacturing and assembly of vital components. However, there are also some deficiencies in this study that will be the focus of future research, including the identification of key parts in non-mechanical products.
Acknowledgements
This project was supported by the Fundamental Research Funds for the Central Universities (No. 2015QNA41).
Reference
“Identification of to-be-improved Components for Redesign of Complex Products and Systems based on Fuzzy QFD and FMEA, ”
DOI:10.1007/s10845-016-1269-z
URL
[Cited within: 2]

Abstract Since the activities to design complex products and systems (CoPSs) mainly focus on redesign of the existing CoPSs to satisfy customer requirements and improve product reliability, identification of the to-be-improved components plays a key role in the redesign process. In the existing methods to identify the to-be-improved components, customer requirements are primarily considered while the failure knowledge, a critical information to improve product reliability, is often ignored. The objective of this research is to identify the to-be-improved components considering both customer requirements and product reliability. The customer requirements are used in redesign through quality function deployment, while the reliability is used in redesign through failure mode and effects analysis (FMEA). Different from the traditional FMEA, the failure causality relationships between and within components are analyzed in this work to provide a means of making use of failure information more effectively for constructing a directed failure causality relationship network. In this network, the failure modes of all components are modeled as vertices, and the causality relationships between failure modes are modeled as directed edges. A new index is introduced to calculate the importance of component from the viewpoint of reliability through integrating the internal and external failure effects. Fuzzy permanent function is developed to measure the internal failure effects, while the external failure effect index is developed to measure the external failure effects. A case study for identification of the to-be-improved components for the operation device of a crawler crane is implemented to demonstrate the effectiveness of the developed approach.
“Design Modification Supporting Method based on Product Usage Data in Closed-loop PLM, ”
“Towards Software Architecture Physiology: Identifying Vital Components, ”
“A Group Decision-Making Approach to Uncertain Quality Function Deployment based on Fuzzy Preference Relation and Fuzzy Majority, ”
DOI:10.1016/j.ejor.2014.09.017
URL
[Cited within: 2]

Quality function deployment (QFD) is one of the very effective customer-driven quality system tools typically applied to fulfill customer needs or requirements (CRs). It is a crucial step in QFD to derive the prioritization of design requirements (DRs) from CRs for a product. However, effective prioritization of DRs is seriously challenged due to two types of uncertainties: human subjective perception and customer heterogeneity. This paper tries to propose a novel two-stage group decision-making approach to simultaneously address the two types of uncertainties underlying QFD. The first stage is to determine the fuzzy preference relations of different DRs with respect to each customer based on the order-based semantics of linguistic information. The second stage is to determine the prioritization of DRs by synthesizing all customers' fuzzy preference relations into an overall one by fuzzy majority. Two examples, a Chinese restaurant and a flexible manufacturing system, are used to illustrate the proposed approach. The restaurant example is also used to compare with three existing approaches. Implementation results show that the proposed approach can eliminate the burden of quantifying qualitative concepts and model customer heterogeneity and design team's preference. Due to its easiness, our approach can reduce the cognitive burden of QFD planning team and give a practical convenience in QFD planning. Extensions to the proposed approach are also given to address application contexts involving a wider set of HOQ elements. (C) 2014 Elsevier B.V. All rights reserved.
“Identifying the Productive and Influential Bloggers in a Community, ”
DOI:10.1109/TSMCC.2010.2099216
URL
[Cited within: 2]
Social networking has become one of the most important trends on the Web, leading to the development of several social applications such as blogs. Blogs are locations on the Web where individuals are provided with the ability to express their opinion, experience, and knowledge about a product, an event, or any other subject. The tremendous popularity of these services has rendered the problem of identifying the most influential bloggers significant, since its solution can lead to numerous major benefits for commerce, advertising, and searching. The current works on this topic either ignore temporal aspects or they fail to gracefully incorporate recency, productivity, and influence at the same time. This paper investigates the issue of identifying bloggers who are both productive and influential by introducing the blogger's productivity index and blogger's influence index. The proposed metrics are evaluated against the state-of-the-art influential blogger identification methods by employing data collected from a real-world community blog site. The obtained results confirm that the new methods are able to identify significant patterns in the bloggers' behavior.
“Immunization of Susceptible-Infected Model on Scale-Free Networks, ”
DOI:10.1016/j.physa.2007.04.107
URL
[Cited within: 1]
In this paper, we investigate two major immunization strategies, random immunization and targeted immunization, of the susceptible–infected (SI) model on the Barabási–Albert (BA) networks. For the heterogeneous structure, the random strategy is quite ineffective if the vaccinated proportion is small, while the targeted one which prefers to vaccinate the individuals with the largest degree can sharply depress the epidemic spreading even only a tiny fraction of population are vaccinated. The analytical solution is also obtained, which can capture the trend of velocity change vs. the amount of vaccinated population.
“Immunization of Complex Networks, ”
“Evaluating the Importance of Nodes in Complex Networks, ”
“Structure and Dynamics of Molecular Networks: A Novel Paradigm of Drug Discovery: A Comprehensive Review, ”
DOI:10.1016/j.pharmthera.2013.01.016
URL
PMID:3647006
[Cited within: 1]
Despite considerable progress in genome- and proteome-based high-throughput screening methods and in rational drug design, the increase in approved drugs in the past decade did not match the increase of drug development costs. Network description and analysis not only give a systems-level understanding of drug action and disease complexity, but can also help to improve the efficiency of drug design. We give a comprehensive assessment of the analytical tools of network topology and dynamics. The state-of-the-art use of chemical similarity, protein structure, protein protein interaction, signaling, genetic interaction and metabolic networks in the discovery of drug targets is summarized. We propose that network targeting follows two basic strategies. The "central hit strategy" selectively targets central nodes/edges of the flexible networks of infectious agents or cancer cells to kill them. The "network influence strategy" works against other diseases, where an efficient reconfiguration of rigid networks needs to be achieved by targeting the neighbors of central nodes/edges. It is shown how network techniques can help in the identification of single-target, edgetic, multi-target and allo-network drug target candidates. We review the recent boom in network methods helping hit identification, lead selection optimizing drug efficacy, as well as minimizing side-effects and drug toxicity. Successful network-based drug development strategies are shown through the examples of infections, cancer, metabolic diseases, neurodegenerative diseases and aging. Summarizing >1200 references we suggest an optimized protocol of network-aided drug development, and provide a list of systems-level hallmarks of drug quality. Finally, we highlight network-related drug development trends helping to achieve these hallmarks by a cohesive, global approach. (C) 2013 Elsevier Inc. All rights reserved.
“Fuzzy Multiple Objective Programming Framework to Prioritize Design Requirements in Quality Function Deployment, ”
“Fuzzy Linear Programming Models for New Product Design Using QFD with FMEA, ”
“Evaluating the Risk of Failure using the Fuzzy OWA and DEMATEL Method, ”
“Modeling of Product Family Stricture and Module Analysis Method based on Complex Network, ”
“Function Module Partition for Complex Products and Systems based on Weighted and Directed Complex Networks, ”
“Research on Complex Product Design Change Propagation based on Complex Networks, ”
DOI:10.1109/ICITM.2017.7917900
URL
[Cited within: 1]
How to accurately evaluate the impact of design change during the whole design, and make decisions on the change request is the most important problem facing the complex product design changes. By means of studying the change rule of node state and the mechanism of change propagation in complex product design network, the improved cuckoo search algorithm is used to solve the design change propagation path, which lays a foundation for comprehensive and accurate evaluation of the influence of change on complex product design.
“Seeking the Important Nodes of Complex Networks in Product R&D Team based on Fuzzy AHP and TOPSIS, ”
“Identifying Influential Spreaders by Weighted LeaderRank, ”
DOI:10.1016/j.physa.2014.02.041
URL
[Cited within: 2]
61Ranking influential spreaders is significant for many real problems.61Weighted LeaderRank outperforms degree centralities.61Weighted LeaderRank provides more accurate and robust solution than LeaderRank.
“Epidemic Spreading on Heterogeneous Networks with Identical Infectivity, ”
DOI:10.1016/j.physleta.2006.12.021
URL
[Cited within: 2]
In this Letter, we propose a modified susceptible-infected-recovered (SIR) model, in which each node is assigned with an identical capability of active contacts, A, at each time step. In contrast to the previous studies, we find that on scale-free networks, the density of the recovered individuals in the present model shows a threshold behavior. We obtain the analytical results using the mean-field theory and find that the threshold value equals 1 / A, indicating that the threshold value is independent of the topology of the underlying network. The simulations agree well with the analytic results. Furthermore, we study the time behavior of the epidemic propagation and find a hierarchical dynamics with three plateaus. Once the highly connected hubs are reached, the infection pervades almost the whole network in a progressive cascade across smaller degree classes. Then, after the previously infected hubs are recovered, the disease can only propagate to the class of smallest degree till the infected individuals are all recovered. The present results could be of practical importance in the setup of dynamic control strategies.
“Vital Nodes Identification in Complex Networks, ”
DOI:10.1016/j.physrep.2016.06.007
URL
[Cited within: 2]
Real networks exhibit heterogeneous nature with nodes playing far different roles in structure and function. To identify vital nodes is thus very significant, allowing us to control the outbreak of epidemics, to conduct advertisements for e-commercial products, to predict popular scientific publications, and so on. The vital nodes identification attracts increasing attentions from both computer science and physical societies, with algorithms ranging from simply counting the immediate neighbors to complicated machine learning and message passing approaches. In this review, we clarify the concepts and metrics, classify the problems and methods, as well as review the important progresses and describe the state of the art. Furthermore, we provide extensive empirical analyses to compare well-known methods on disparate real networks, and highlight the future directions. In spite of the emphasis on physics-rooted approaches, the unification of the language and comparison with cross-domain methods would trigger interdisciplinary solutions in the near future.
“Information and Influence Propagation in Social Networks, ”
DOI:10.2200/S00527ED1V01Y201308DTM037
URL
[Cited within: 3]
Research on social networks has exploded over the last decade. To a large extent, this has been fueled by the spectacular growth of social media and online social networking sites, which continue growing at a very fast pace, as well as by the increasing availability of very large social network datasets for purposes of research. A rich body of this research has been devoted to the analysis of the propagation of information, influence, innovations, infections, practices and customs through networks. Can we build models to explain the way these propagations occur? How can we validate our models Chen, Wei; Castillo, Carlos; Lakshmanan, Laks V S
“Structural Vulnerability of the North American Power Grid, ”
DOI:10.1103/PhysRevE.69.025103
URL
PMID:14995510
[Cited within: 1]
The magnitude of the August 2003 blackout affecting the United States has put the challenges of energy transmission and distribution into limelight. Despite all the interest and concerted effort, the complexity and interconnectivity of the electric infrastructure precluded us for a long time from understanding why certain events happened. In this paper we study the power grid from a network perspective and determine its ability to transfer power between generators and consumers when certain nodes are disrupted. We find that the power grid is robust to most perturbations, yet disturbances affecting key transmission substations greatly reduce its ability to function. We emphasize that the global properties of the underlying network must be understood as they greatly affect local behavior.
“Who is the Best Player Ever? A Complex Network Analysis of the History of Professional Tennis, ”
DOI:10.1371/journal.pone.0017249
URL
PMID:21339809
[Cited within: 1]
We considered all matches played by professional tennis players between 1968 and2010, and, on the basis of this data set, constructed a directed and weighted network of contacts. The resulting graph showed complex features, typical of many real networked systems studied in literature. We developed a diffusion algorithm and applied it to the tennis contact network in order to rank professional players. Jimmy Connors was identified as the best player in the history of tennis according to our ranking procedure. We performed a complete analysis by determining the best players on specific playing surfaces as well as the best ones in each of the years covered by the data set. The results of our technique were compared to those of two other well established methods. In general, we observed that our ranking method performed better: it had a higher predictive power and did not require the arbitrary introduction of external criteria for the correct assessment of the quality of players. The present work provides novel evidence of the utility of tools and methods of network theory in real applications.
“Diffusion of Scientific Credits and the Ranking of Scientists, ”
DOI:10.1103/PhysRevE.80.056103
URL
PMID:20365039
[Cited within: 1]
Recently, the abundance of digital data is enabling the implementation of graph-based ranking algorithms that provide system level analysis for ranking publications and authors. Here, we take advantage of the entire Physical Review publication archive (1893-2006) to construct authors' networks where weighted edges, as measured from opportunely normalized citation counts, define a proxy for the mechanism of scientific credit transfer. On this network, we define a ranking method based on a diffusion algorithm that mimics the spreading of scientific credits on the network. We compare the results obtained with our algorithm with those obtained by local measures such as the citation count and provide a statistical analysis of the assignment of major career awards in the area of physics. A website where the algorithm is made available to perform customized rank analysis can be found at the address http://www.physauthorsrank.org.
“Quantifying the Influence of Scientists and their Publications: Distinguishing Between Prestige and Popularity, ”
“Applying the Design Structure Matrix to System Decomposition and Integration Problems: A Review and New Directions, ”
“Complex Concurrent Engineering and the Design Structure Matrix Method, ”
“Product Design Knowledge Management based on Design Structure Matrix, ”
DOI:10.1016/j.aei.2009.08.005
URL
[Cited within: 1]
To speed up the product design efficiency, product designers would like to utilize the past experience and know-how in assisting the design of new products or in the enhancement of existing one. What is needed is a systematic and structured way for product design knowledge capturing, organization, and reuse. Design structure matrix (DSM), a structured method which has advantages on representing and analysing interaction relations among system elements, is considered to be a suitable means to capture and manage the system-level design knowledge. The captured knowledge through DSM can improve understanding the design routes and design history by linking designed items to rationales, decisions and assumptions. Meanwhile, the captured knowledge through DSM could assist designers to predict changes on existing solutions, and to reuse the existing solutions in new projects. The main outcome of this paper is focused on how to capture and trace the design knowledge through single-domain DSM and multi-domain DSMs, respectively. Finally a DSM-based design knowledge management system is introduced, which can enable the efficient knowledge capturing, searching, and tracing in product design.
“Impact Propagation and Risk Assessment of Requirement Changes for Software Development Projects based on Design Structure Matrix, ”
DOI:10.1016/j.ijproman.2011.08.004
URL
[Cited within: 1]
78 We analyzed iterative relation between requirement changes and software architecture. 78 We defined change propagation risk by propagation probability and change impact. 78 We built a probabilistic model based on DSM to evaluate change propagation risk. 78 We compared change propagation risk of different probability strength variations. 78 We estimated impact of requirement change on project schedule and cost.
“Identifying Influential Nodes in Complex Networks, ”
“The Anatomy of a Large Scale Hypertextual Web Search Engine, ”
DOI:10.1016/S0169-7552(98)00110-X
URL
[Cited within: 1]
In this paper, we present Google, a prototype of a large-scale search engine which makes heavy use of the structure present in hypertext. Google is designed to crawl and index the Web efficiently and produce much more satisfying search results than existing systems. The prototype with a full text and hyperlink database of at least 24 million pages is available at To engineer a search engine is a challenging task. Search engines index tens to hundreds of millions of web pages involving a comparable number of distinct terms. They answer tens of millions of queries every day. Despite the importance of large-scale search engines on the web, very little academic research has been done on them. Furthermore, due to rapid advance in technology and web proliferation, creating a web search engine today is very different from three years ago. This paper provides an in-depth description of our large-scale web search engine -- the first such detailed public description we know of to date. Apart from the problems of scaling traditional search techniques to data of this magnitude, there are new technical challenges involved with using the additional information present in hypertext to produce better search results. This paper addresses this question of how to build a practical large-scale system which can exploit the additional information present in hypertext. Also we look at the problem of how to effectively deal with uncontrolled hypertext collections where anyone can publish anything they want.
“Leaders in Social Networks, the Delicious Case, ”
“Can Developer-Module Networks Predict Failures, ”
in
“Developer Prioritization in Bug Repositories, ”
in
“Identification of Influential Function Modules within Complex Products and Systems based on Weighted and Directed Complex Networks, ”
DOI:10.1007/s10845-018-1396-9
URL
[Cited within: 1]
As a cost saving and profit-making strategy, a modular design is being employed in developing complex products and systems (CoPS) in recent decades. At the early stage of design, the reliability of a...
