


1. Introduction
Hepatocellular carcinoma is a common cancer that is responsible for many deaths each year [1]. Computed tomography (CT) image diagnosis can help doctors accurately evaluate the liver cancer and develop a treatment plan. In the general diagnosis process, the liver condition and liver lesions are determined by a radiologist according to the CT image slice by slice. This is highly time-consuming and also produces different results among different doctors. Therefore, the automatic segmentation of liver and liver tumors is of great value to clinical diagnosis.
Based on image processing technology, traditional liver segmentation mainly relies on some superficial features of the image, such as grayscale, statistical structure, and texture, to segment the liver contour. These superficial features, which can be obtained directly from the image or by a manually designed extraction operator, are less robust, less representative, and susceptible to noise interference [2]. It has been proven by practice that the abstract, deep features are often more representative. Deep learning technology can mine the deep abstract features of data from a large amount of data [3].
The liver and other neighboring organs have low intensity, so it is very challenging to automatically delineate the liver from CT images. As shown in Figure 1, radiologists usually use an injection protocol to enhance CT scans to clearly observe the tumor, and this may increase the image noise in the liver area. Liver tumor segmentation is a more challenging task compared toliver segmentation. First, liver tumors have different sizes, shapes, positions, and numbers in a patient, which are obstacles to automatic segmentation, as depicted in Figure 1. Second, there exist no clear boundaries in some tumors, which limits the performance of edge-based methods. Third, the accuracy of CT scans has a high degree of difference (the voxel range of 0.45mm to 6.0mm), further increasing the challenge of automatic segmentation.
Figure 1
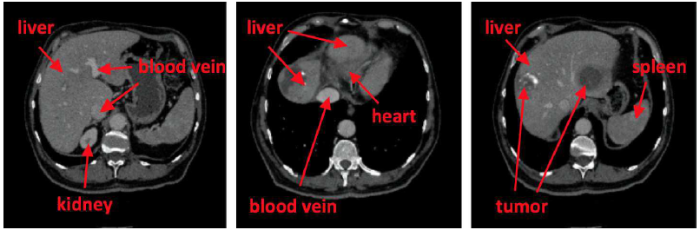
Figure 1.
Examples of contrast-enhanced CT slices
To solve these difficulties, researchers need to effectively extract the image features. In recent years, the effect of FCNs on medical image segmentation has been very impressive. As far as the liver and liver tumor segmentation are concerned, many researchers use the deep learning methods, mainly divided into two categories:(1) 2D FCNs, such as U-Net architecture [4], multichannel FCN [5], and FCN on the basis of VGG-16 [6]. (2) 3D FCNs, in which the 3D convolutions replacethe 2D convolutions [7].
However, 2D FCNs ignore the spatial information along the Z-axis, which might result in limited segmentation performance, or some adjacent slices are captured from a 3D image into a 2D FCN [5-6]. Despite the utilization of adjacent slices, it is still not enough to make full use of the spatial correlation of all third dimensions. This case may result in the degradation of segmentation accuracy. Compared with 2D FCNs, 3D FCNs require a large amount of computational resources (such as memory and computation time) [8]. 3D convolution, which consumes many computational resources, also hinder its application in training large-scale data sets. Faced with the above problems, we propose a novel 3D perspective based FCN, train FCNs in the three orthogonal planes of the 3D image to extract the features of the 2D image effectively, and then integrate the three models into the 3D spatial information. At the same time, we use a cascaded architecture to train the liver and liver tumor models and use the weighted cross entropy loss function to effectively handle the problem of sample balance. The proposed method achieves a better performance overall than the existing methods.
2. Related Work
CT technology can effectively solve the shortcomings of common X-ray imaging blur and poor tissue resolution. It can clearly visualize the structure of soft tissues and solve the imaging problem where certain parts aredifficult for common X-rays to shoot. At the same time, the technological advancement of bulb detectors and the popularization of low-dose technology have greatly improved the accuracy and safety of clinical diagnosis. Because of the high resolution of CT imaging and the obvious imaging of soft tissues, the pathological organs can be highlighted. Furthermore, the costs are moderate. Therefore, CT technology is widely used in the diagnosis of liver diseases. As a metabolically active organ in the human body, the liver is the largest organ and the largest digestive gland in the human body and participates in a variety of physiological activities.Therefore, it is of great importance. It is vital to accurately diagnose liver disease as it is also very dangerous. Abdominal CT imaging is a common method for detecting abdominal organ lesions or soft tissue lesions, along with quantitative analysis of disease progression and three-dimensional visualization modeling.
Accurate and reliable segmentation of liver contour from abdominal CT images is the first step in the early diagnosis of liver disease. Estimation and three-dimensional modeling of the liver size and disease are alsovery critical steps. The segmentation results have a direct impact on follow-up work. In practical clinical applications, liver contours are manually segmented from CT images by physicians with relevant practical experience and expertise. However, this process is very time-consuming and energy-consuming. Moreover, different segmentation results may be achieved due to subjective factors, such as different physicians' experience and knowledge. Therefore, in order to reduce the workload of doctors, improve work efficiency, and obtain more objective and accurate segmentation results, it is necessary to introduce computer-aided diagnosis technology to help physicians segment liver CT images.
Over the past few decades, many algorithms, such as threshold based approaches, regional growth methods, deformable model based methods, and machine learning based approaches, have been proposed. Approachesbased on the thresholdclassify the object and background in accordance with whether the intensity of an image pixel is higher than a certain threshold. Regional growth methods are also common in liver and lesion segmentation tasks. Researchers pay attention to the level set method on the advantages of numerical computations of the curve and the surface. Many machine learning based approaches, dealing with segmentation of liver tumors, have also been devised.
CNN has achieved great improvement in object recognition. Likewise, many researchers have proposed various methods based on FCNs for segmentation of liver and liver lesions. For example, an FCN solution [6] to liver segmentation and metastases has been proposed. At the same time, [5] designed an approach for segmenting liver tumors. The probability graph of the model was generated by multi-channel feature fusion.
3D based CNN algorithms [8-9] have also recently emerged, with the aim of extracting more discriminative volumetric features. For instance, [9] devised a 3Dnetwork for dual paths that uses dense inference techniques in image segments to overcome the computational burden. The 2D U-Net is expanded by 3D U-Net into 3D variation, consisting of an encoding path for extracting the features of the input image. The same resolution applied in skipping connections between layerswas established by the encoding and decoding paths. V-Net is used to solve the imbalance of training data. VoxResNet was inspired by the idea of a 2D depth residual network [10] to construct a very deep 3D network.
3. The Proposed Algorithm
The overview of the network is shown in Figure 2. Slices are cropped according to three different planes of the CT volume, which are fed into three different FCNs. Then, the results of liver segmentation are combined. After that, the intensity of the image outside the liver is set to zero, and slices are cropped according to three different planes, which are fed into three different FCNs as well. Finally, the results of tumor segmentation are combined.
Figure 2
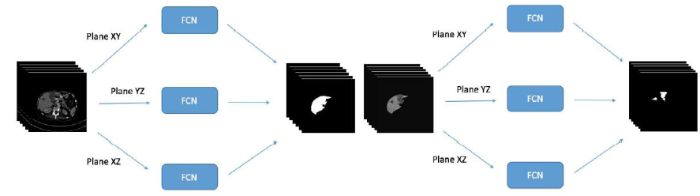
Figure 2.
Overview of our framework
The architecture of FCN is shown in Figure 3. This is a cascaded-structure network that combines the liver segmentation model with the tumor segmentation model, and each model is fused together by an FCN of different 3D perspectives. The orange arrows present convolutionwith non-linear activation, the gray arrows show concatenation, the red arrows indicate down-sampling, and the green arrows indicate up-sampling. There is a total of four layers.The initial number of first layers in thefeature mapis 64, and the number is expanded to double in size layer by layer. The details of each part will be described in detail below.
Figure 3
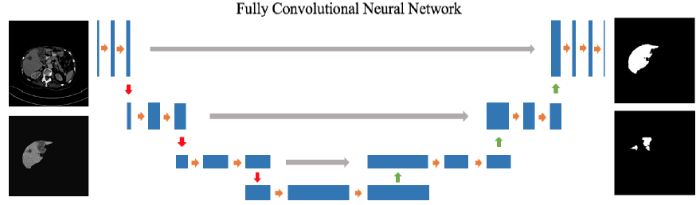
Figure 3.
Overview of FCN
The preprocessing of CT images mainly involves the following steps. The pipeline of data preprocessing is shown in Figure 4.
Figure 4
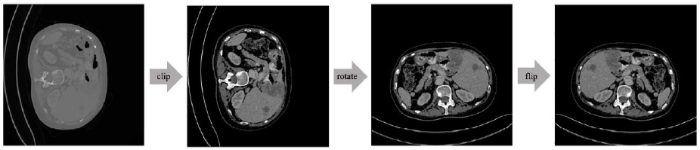
Figure 4.
The pipeline of data preprocessing
First, different hospitals may use different CT devices, and different CT devices will produce images in different orientations, including the fact that the liver is on the left or right, and the body is supine or prone. To reduce the data complexity, it is necessary to rotate the CT image up and down or left and right to a uniform orientation. In this paper, the body is regarded as supine with the liver on the left side as the standard orientation of the image. Second, in order to exclude the effects of the existence of other organs or structures around the liver, the Hounsfield unit value of the CT image is set between -100 and 400 [11] to enhance the contrast between the normal liver, the liver tumor, and other abdominal tissues. Finally, to reduce the presence of noise in the data annotation, the area marked with the liver that is less than 128 pixels and the area marked with the liver tumor that is less than 32 pixels are removed.
The latter part of a classic CNN, such as [12] and [2], is usually a fully connected layer. Although it can effectively use the pixel spatial information, the calculation complexity is very large. [13] used the deconvolution layer instead of the fully connected layer and proposed an FCN. The first half of the FCN uses the convolution layer to obtain images, and the second half amplifies the feature map to match the input image.
${{x}^{l-1}}$ and ${{x}^{l}}$ are set as the input and output of the ${{l}^{\text{th}}}$ layer, respectively. The output of the ${{\left( l+1 \right)}^{\text{th}}}$ layer equals the input to the ${{l}^{\text{th}}}$ layer. The ${{j}^{\text{th}}}$ feature map of layer $l$is denoted as $x_{j}^{l}$. The output is implemented in Formula (1).
Where $*$ denotes the convolution operation. $\sigma \left( \cdot \right)$ is a function that is nonlinear activation, e.g., Rectified Linear Units (ReLU) [14]. $\omega _{ij}^{l}$ is the kernel linking ${{i}^{\text{th}}}$ to ${{j}^{\text{th}}}$. Finally, the scalar $b_{j}^{l}$ is the parameter for the${{j}^{\text{th}}}$ feature map output of the ${{l}^{\text{th}}}$ layer.
Pooling is used as the down-sampling layer, where the output of the ${{j}^{\text{th}}}$ feature map of layer $l$ is shown in Formula (2).
Where $\beta _{j}^{l}$ and $b_{j}^{l}$ are bias terms. $down\left( \cdot \right)$ is a down-sampling function that reduces the size of feature maps and enlarges the receptive field of convolution kernels. Deconvolution is used in the up-sampling layer, and it is similar to convolution except that it upscales the feature map before convolution. The output is given as Formula (3).
Where $up\left( \cdot \right)$ is an up-sampling function.
Without the full connection layer, the FCN has no limit on the input image size and can classify pixels of the entire image at once. However, with an increase in convolution layers, the output results are relatively rough. [15] proposed U-Net to further improve the FCN. U-Net is divided into the encoding and decoding stage. The encoding stage can obtain the semantic image features. The decoding stage amplifies the feature map with convolution and deconvolution layers and integrates the feature maps of the coding and decoding stages to improve the accuracy of output. It achieves pixel-level segmentation of the entire image. The convolution layer will reduce the size of the image. For example, U-Net is fed with images in a size of 512512, and the output is in a size of 388388. Therefore, input needs to be padded with zero. In order to overcome this shortcoming, images are padded before each convolution layer, so the size of the image is constant during convolution. The networksize of the input and output are exactly the same. The network is completely symmetrical and eliminates the restrictions on the input image size.
A cascaded CNN is used to achieve the liver and live tumor segmentation [11]. The two models are cascaded together. The prior model segments the liver from other tissues while the posterior model segments the tumor from the liver. In order to exclude the interference from other organs, the researchers use the results of the liver segmentation model to segment the image of the liver part of the initial image, because FCN does not have the constraint of input image size. In the segmentation of the liver tumor, all non-hepatic part are filled with 0 and then entered into the tumor segmentation model. The motivation of cascaded CNN is that CNN can learn a hierarchical representation from CT volumes. By cascading two CNN together, the researchers can make the prior model specific for separating the liver from other abdominal organs and the posterior model specific for separating lesions from normal liver tissue. The liver region from the liver model can also reduce false positives in the lesion model.
Previous works usually build 2D CNNs based on transverse planes [16-18]. Some models require an input of a few consecutive slices [19], which are called 2.5D CNN. They cannot fully use the spatial information in 3D CT images. Therefore, the researchers propose a triplanar FCN model. As shown in Figure 5, there are some examples of CT images in the transverse plane, coronal plane, and sagittal plane respectively. The liver and tumor exhibit different shapes and contours in different planes. In clinical routine, radiologists diagnose mainly based on the images in the transverse plane. They will refer to the images in the coronal plane and sagittal plane when it is necessary. Thus, three models are trained according to each plane. To leverage the spatial information, the results of the three models are integrated by majority voting. It is noted that the area of the liver in the abdomen is small as well as the area of the tumor in the liver. For class balance, the weighted entropy is used as the loss function, as calculated in Formula (4).
Where ${{y}_{i}}$ represents the probability that pixel $i$ is part of the foreground and 1-${{\widehat{y}}_{i}}$denotes the ground truth.
Figure 5
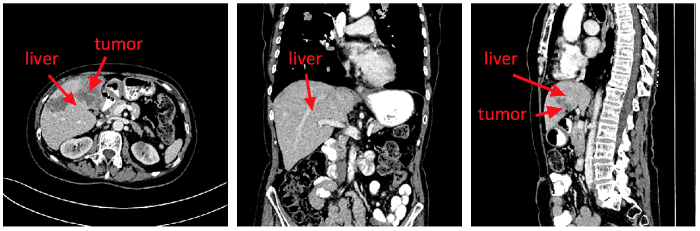
Figure 5.
The examples of CT images in the transverse plane, coronalplane,and sagittal plane respectively
4. Experiments
This section first introduces the datasets and experiment metrics and then explains the parameter setting of the experiment. The effect of the method mentioned in this paper is verified and compared with the existing method.
The experiment employs the public 3DIRCADb database. 3DIRCADb consists of 20 intravenous 3D enhanced CT samples, including ten females and ten males, of which 75% suffer from liver tumors. The data comes from a number of European hospitals with different types of CT scanners. In this experiment, 15 samples with liver tumors are selected to train and evaluate our model and make a 2-fold cross validation.
The metrics in [1] are adoptedby experiment section to assessthe liver segmentation performance. X is setasthe foreground in the ground truth and Y as the predicted foreground.
DICE is the main quality metric and is evaluated as Formula (5).
The DICE score ranges from 0 to 1.
The volume overlap error (VOE) is defined in Formula (6), and it is also known as Jaccard [19].
The relative volume difference (RVD) is defined in Formula (7).
The average symmetric surface distance (ASD) is presented in Formula (8).
The maximum surface distance (MSSD) is defined in Formula (9).
The model is implemented with Tensorflow [17] without pre-trained weights. When calculating the loss, the background’s weight is set to 1 while the weight of the foreground is set to 3. Meanwhile, during the liver tumor segmentation, the background’s weight is set to 1 while the weight of the foreground is set to 6. The Adam optimizer is used to assessthe model based on an original learning rate of 0.0005. This model uses the same hyper-parameter settings on each plane.
To obtain improved performance of our proposed triplanar FCN, the metrics with ordinary FCN are compared on the 3DIRCADb dataset. First, three base models are trained based on the transverse plane, coronalplane, and sagittal plane, respectively called FCN YZ, FCN XZ, and FCN XY. The results of liver and lesion segmentation are illustrated respectively in Tables 1 and 2. The model based on the transverse plane obtains the best performance among the three models for both the liver and tumor. Then, these models are integrated into a triplanar FCN model. The integrated model achieves better results, where the VOE for the liver is reduced from 8.9% to 6.7% while the VOE for the lesion is reduced from 16.3% to 13.3%. Figure 6 depicts the original CT scans (first column), ground truth, outputs of the three base models (last three columns), and triplanar FCN (third column). It shows that there are few diversities among the outputs of the three base models due to the spatial information of their own plane. By integrating these models, the triplanar FCN can introduce more spatial information and improve the segmentation accuracy.
Table 1. Segmentation performance results of liver for different parameters
| Approach | VOE[%] | RVD[%] | ASD[mm] | MSSD[mm] |
|---|---|---|---|---|
| FCN YZ | 10.8 | 4.5 | 4.2 | 16.7 |
| FCN XZ | 11.5 | 5.7 | 3.4 | 20.4 |
| FCN XY | 8.9 | -2.3 | 1.2 | 9.3 |
| Triplanar FCN | 6.7 | 3.5 | 0.7 | 6.5 |
Table 2. Segmentation performance results of tumor for different parameters
| Approach | VOE[%] | RVD[%] | ASD[mm] | MSSD[mm] |
|---|---|---|---|---|
| FCN YZ | 22.8 | -8.3 | 12.3 | 15.7 |
| FCN XZ | 25.7 | 13.8 | 11.4 | 19.9 |
| FCN XY | 16.3 | -3.3 | 2.8 | 8.9 |
| Triplanar FCN | 13.3 | 6.3 | 1.8 | 7.5 |
Figure 6
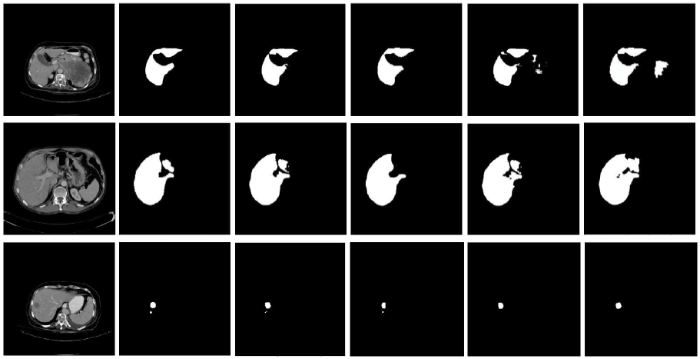
Figure 6.
Examples of segmentation results
For comparison with advanced methods, other methods’ results in the liver and tumor segmentation are also presented, such as the likelihood and local constraint (LLC) level set model [20], deformable graph cut [21], and other FCNs [5,11]. The results of segmentation performance of the liver and tumor are illustrated in Tables 3 and 4 respectively. They show that our method achieves good results on 3DIRCADb and excels compared to the other two algorithms in terms of the VOE, ASD, and MSSD on the liver andthe VOE and ASD on tumors. The RVD value of the triplanar FCN is 3.5% on the liver, which indicates that it tends to be slightly over-segmented. The RVD and MSSD values of thetriplanar FCN are 6.3% and 7.5 mm respectively on tumors. They are close to the values of the other two methods, which means the triplanar FCN has similar stability but produces an improved segmentation. This demonstrates the superiority of the triplanar FCN in dealing with the segmentation of the liver and tumors.
Table 3. Segmentation performance results of liver
Table 4. Segmentation performance results of tumor
5. Conclusion
Liver tumors are characteristic of high malignancy and rapid disease development. The mortality rate of liver tumors ranks second in the world while China is one of the highest incidence areas of liver cancer. CT has been extensivelyapplied in diagnosis, especially forliver diseases, and it has become the preferred method for diagnosing liver diseases. The use of computer image processing technology, combined with medical imaging diagnostic technology for early diagnosis, three-dimensional modeling, and quantitative analysis of liver diseases, enables doctors to grasp sufficient data before surgery, make preoperative planning, improve the success rate of surgery, and formulate reasonable and effective treatment plans.
In this work, the researchers devise a triplanar FCN model solution for liver and tumors segmentation. By fusing the 2D FCN trained on the transverse plane, coronalplane, and sagittal plane, the spatial information of 3D enhanced CT images can be effectively utilized. It also can avoid the huge computational complexity of 3D convolution networks. In further works, the researchers of this paper would like to explore how they can integrate the three perspectives of the model more effectively, because it is still time-consuming to integrate three models. It could possibly be made more adaptive and trainable. The researchers will also apply the model to other types of segmentation.
Acknowledgements
This study was supported by the Program of Scientific Research of Anhui Province, China (No. TSKJ2017B26) and the Open Research Fund of Wanjiang Collaborative Innovation Center for High-end Manufacturing Equipment(No. GCKJ2018007).
Reference
H-DenseUNet: Hybrid Densely Connected UNet for Liver and Tumor Segmentation from CT Volumes
,”
DOI:10.1109/TMI.2018.2845918
URL
PMID:29994201
[Cited within: 3]

Abstract: Liver cancer is one of the leading causes of cancer death. To assist doctors in hepatocellular carcinoma diagnosis and treatment planning, an accurate and automatic liver and tumor segmentation method is highly demanded in the clinical practice. Recently, fully convolutional neural networks (FCNs), including 2D and 3D FCNs, serve as the back-bone in many volumetric image segmentation. However, 2D convolutions can not fully leverage the spatial information along the third dimension while 3D convolutions suffer from high computational cost and GPU memory consumption. To address these issues, we propose a novel hybrid densely connected UNet (H-DenseUNet), which consists of a 2D DenseUNet for efficiently extracting intra-slice features and a 3D counterpart for hierarchically aggregating volumetric contexts under the spirit of the auto-context algorithm for liver and tumor segmentation. We formulate the learning process of H-DenseUNet in an end-to-end manner, where the intra-slice representations and inter-slice features can be jointly optimized through a hybrid feature fusion (HFF) layer. We extensively evaluated our method on the dataset of MICCAI 2017 Liver Tumor Segmentation (LiTS) Challenge and 3DIRCADb Dataset. Our method outperformed other state-of-the-arts on the segmentation results of tumors and achieved very competitive performance for liver segmentation even with a single model.
Very Deep Convolutional Networks for Large-Scale Image Recognition
”Abstract: In this work we investigate the effect of the convolutional network depth on its accuracy in the large-scale image recognition setting. Our main contribution is a thorough evaluation of networks of increasing depth using an architecture with very small (3x3) convolution filters, which shows that a significant improvement on the prior-art configurations can be achieved by pushing the depth to 16-19 weight layers. These findings were the basis of our ImageNet Challenge 2014 submission, where our team secured the first and the second places in the localisation and classification tracks respectively. We also show that our representations generalise well to other datasets, where they achieve state-of-the-art results. We have made our two best-performing ConvNet models publicly available to facilitate further research on the use of deep visual representations in computer vision.
Optic Disc and Cup Segmentation Methods for Glaucoma Detection with Modification of U-Net Convolutional Neural Network
,”
DOI:10.1134/S1054661817030269
URL
[Cited within: 4]

Glaucoma is the second leading cause of blindness all over the world, with approximately 60 million cases reported worldwide in 2010. If undiagnosed in time, glaucoma causes irreversible damage to the optic nerve leading to blindness. The optic nerve head examination, which involves measurement of cup-todisc ratio, is considered one of the most valuable methods of structural diagnosis of the disease. Estimation of cup-to-disc ratio requires segmentation of optic disc and optic cup on eye fundus images and can be performed by modern computer vision algorithms. This work presents universal approach for automatic optic disc and cup segmentation, which is based on deep learning, namely, modification of U-Net convolutional neural network. Our experiments include comparison with the best known methods on publicly available databases DRIONS-DB, RIM-ONE v.3, DRISHTI-GS. For both optic disc and cup segmentation, our method achieves quality comparable to current state-of-the-art methods, outperforming them in terms of the prediction time.
A Guide to Convolution Arithmetic for Deep Learning
”Abstract: We introduce a guide to help deep learning practitioners understand and manipulate convolutional neural network architectures. The guide clarifies the relationship between various properties (input shape, kernel shape, zero padding, strides and output shape) of convolutional, pooling and transposed convolutional layers, as well as the relationship between convolutional and transposed convolutional layers. Relationships are derived for various cases, and are illustrated in order to make them intuitive.
Towards Intelligent Robust Detection of Anatomical Structures in Incomplete Volumetric Data
,”
DOI:10.1016/j.media.2018.06.007
URL
[Cited within: 1]
Robust and fast detection of anatomical structures represents an important component of medical image analysis technologies. Current solutions for anatomy detection are based on machine learning, and are generally driven by suboptimal and exhaustive search strategies. In particular, these techniques do not effectively address cases of incomplete data, i.e., scans acquired with a partial field-of-view. We address these challenges by following a new paradigm, which reformulates the detection task to teaching an intelligent artificial agent how to actively search for an anatomical structure. Using the principles of deep reinforcement learning with multi-scale image analysis, artificial agents are taught optimal navigation paths in the scale-space representation of an image, while accounting for structures that are missing from the field-of-view. The spatial coherence of the observed anatomical landmarks is ensured using elements from statistical shape modeling and robust estimation theory. Experiments show that our solution outperforms marginal space deep learning, a powerful deep learning method, at detecting different anatomical structures without any failure. The dataset contains 5043 3D-CT volumes from over 2000 patients, totaling over 2,500,000 image slices. In particular, our solution achieves 0% false-positive and 0% false-negative rates at detecting whether the landmarks are captured in the field-of-view of the scan (excluding all border cases), with an average detection accuracy of 2.78 millimeters. In terms of runtime, we reduce the detection-time of the marginal space deep learning method by 20-30 times to under 40 milliseconds, an unmatched performance for high resolution incomplete 3D-CT data.
Brain Tumor Segmentation in Multi-Spectral MRI Using Convolutional Neural Networks (CNN)
,”
DOI:10.1002/jemt.22994
URL
PMID:29356229
[Cited within: 2]
Abstract A tumor could be found in any area of the brain and could be of any size, shape, and contrast. There may exist multiple tumors of different types in a human brain at the same time. Accurate tumor area segmentation is considered primary step for treatment of brain tumors. Deep Learning is a set of promising techniques that could provide better results as compared to nondeep learning techniques for segmenting timorous part inside a brain. This article presents a deep convolutional neural network (CNN) to segment brain tumors in MRIs. The proposed network uses BRATS segmentation challenge dataset which is composed of images obtained through four different modalities. Accordingly, we present an extended version of existing network to solve segmentation problem. The network architecture consists of multiple neural network layers connected in sequential order with the feeding of Convolutional feature maps at the peer level. Experimental results on BRATS 2015 benchmark data thus show the usability of the proposed approach and its superiority over the other approaches in this area of research.
YOLO9000: better, faster, stronger
”
DOI:10.1109/CVPR.2017.690
URL
[Cited within: 1]
We introduce YOLO9000, a state-of-the-art, real-time object detection system that can detect over 9000 object categories. First we propose various improvements to the YOLO detection method, both novel and drawn from prior work. The improved model, YOLOv2, is state-of-the-art on standard detection tasks like PASCAL VOC and COCO. Using a novel, multi-scale training method the same YOLOv2 model can run at varying sizes, offering an easy tradeoff between speed and accuracy. At 67 FPS, YOLOv2 gets 76.8 mAP on VOC 2007. At 40 FPS, YOLOv2 gets 78.6 mAP, outperforming state-of-the-art methods like Faster RCNN with ResNet and SSD while still running significantly faster. Finally we propose a method to jointly train on object detection and classification. Using this method we train YOLO9000 simultaneously on the COCO detection dataset and the ImageNet classification dataset. Our joint training allows YOLO9000 to predict detections for object classes that dont have labelled detection data. We validate our approach on the ImageNet detection task. YOLO9000 gets 19.7 mAP on the ImageNet detection validation set despite only having detection data for 44 of the 200 classes. On the 156 classes not in COCO, YOLO9000 gets 16.0 mAP. YOLO9000 predicts detections for more than 9000 different object categories, all in real-time.
Adapting Mask-RCNN for Automatic Nucleus Segmentation
”Automatic segmentation of microscopy images is an important task in medical image processing and analysis. Nucleus detection is an important example of this task. Mask-RCNN is a recently proposed state-of-the-art algorithm for object detection, object localization, and object instance segmentation of natural images. In this paper we demonstrate that Mask-RCNN can be used to perform highly effective and efficient automatic segmentations of a wide range of microscopy images of cell nuclei, for a variety of cells acquired under a variety of conditions.
Multi-Scale Context aggregation by Dilated Convolutions
”Abstract: State-of-the-art models for semantic segmentation are based on adaptations of convolutional networks that had originally been designed for image classification. However, dense prediction and image classification are structurally different. In this work, we develop a new convolutional network module that is specifically designed for dense prediction. The presented module uses dilated convolutions to systematically aggregate multi-scale contextual information without losing resolution. The architecture is based on the fact that dilated convolutions support exponential expansion of the receptive field without loss of resolution or coverage. We show that the presented context module increases the accuracy of state-of-the-art semantic segmentation systems. In addition, we examine the adaptation of image classification networks to dense prediction and show that simplifying the adapted network can increase accuracy.
Deep Neural Network Structures Solving Variational Inequalities
”
Learning Intrinsic Image Decomposition from Watching the World
”Abstract: Single-view intrinsic image decomposition is a highly ill-posed problem, and so a promising approach is to learn from large amounts of data. However, it is difficult to collect ground truth training data at scale for intrinsic images. In this paper, we explore a different approach to learning intrinsic images: observing image sequences over time depicting the same scene under changing illumination, and learning single-view decompositions that are consistent with these changes. This approach allows us to learn without ground truth decompositions, and to instead exploit information available from multiple images when training. Our trained model can then be applied at test time to single views. We describe a new learning framework based on this idea, including new loss functions that can be efficiently evaluated over entire sequences. While prior learning-based methods achieve good performance on specific benchmarks, we show that our approach generalizes well to several diverse datasets, including MIT intrinsic images, Intrinsic Images in the Wild and Shading Annotations in the Wild.
Perceiving and Reasoning about Liquids Using Fully Convolutional Networks
,”
DOI:10.1177/0278364917734052
URL
[Cited within: 1]
Liquids are an important part of many common manipulation tasks in human environments. If we wish to have robots that can accomplish these types of tasks, they must be able to interact with liquids in an intelligent manner. In this paper, we investigate ways for robots to perceive and reason about liquids. That is, a robot asks the questions What in the visual data stream is liquid? and How can I use that to infer all the potential places where liquid might be? We collected two datasets to evaluate these questions, one using a realistic liquid simulator and another on our robot. We used fully convolutional neural networks to learn to detect and track liquids across pouring sequences. Our results show that these networks are able to perceive and reason about liquids, and that integrating temporal information is important to performing such tasks well.
NIPS 2016 Tutorial: Generative Adversarial Networks
,”This report summarizes the tutorial presented by the author at NIPS 2016 on generative adversarial networks (GANs). The tutorial describes: (1) Why generative modeling is a topic worth studying, (2) how generative models work, and how GANs compare to other generative models, (3) the details of how GANs work, (4) research frontiers in GANs, and (5) state-of-the-art image models that combine GANs with other methods. Finally, the tutorial contains three exercises for readers to complete, and the solutions to these exercises.
DeepMitosis: Mitosis Detection via Deep Detection, Verification and Segmentation Networks
,”
DOI:10.1016/j.media.2017.12.002
URL
PMID:29455111
[Cited within: 2]
Mitotic count is a critical predictor of tumor aggressiveness in the breast cancer diagnosis. Nowadays mitosis counting is mainly performed by patholo-gists manually, which is extremely arduous and time-consuming. In this paper, we propose an accurate method for detecting the mitotic cells from histopatho-logical slides using a novel multi-stage deep learning framework. Our method consists of a deep segmentation network for generating mitosis region when on-ly a weak label is given (i.e., only the centroid pixel of mitosis is annotated), an elaborately designed deep detection network for localizing mitosis by using contextual region information, and a deep veri cation network for improving detection accuracy by removing false positives. We validate the proposed deep learning method on two widely used Mitosis Detection in Breast Cancer His-tological Images (MITOSIS) datasets. Experimental results show that we can achieve the highest F-score on the MITOSIS dataset from ICPR 2012 grand challenge merely using the deep detection network. For the ICPR 2014 MI-TOSIS dataset that only provides the centroid location of mitosis, we employ the segmentation model to estimate the bounding box annotation for training the deep detection network. We also apply the veri cation model to eliminate some false positives produced from the detection model. By fusing scores of the detection and veri cation models, we achieve the state-of-the-art results. More-over, our method is very fast with GPU computing, which makes it feasible for clinical practice.
RobustNucleus/Cell Detection and Segmentation in Digital Pathology and Microscopy Images: A Comprehensive Review
,”
DOI:10.1109/RBME.2016.2515127
URL
PMID:26742143
[Cited within: 3]
Abstract Digital pathology and microscopy image analysis is widely used for comprehensive studies of cell morphology or tissue structure. Manual assessment is labor intensive and prone to interobserver variations. Computer-aided methods, which can significantly improve the objectivity and reproducibility, have attracted a great deal of interest in recent literature. Among the pipeline of building a computer-aided diagnosis system, nucleus or cell detection and segmentation play a very important role to describe the molecular morphological information. In the past few decades, many efforts have been devoted to automated nucleus/cell detection and segmentation. In this review, we provide a comprehensive summary of the recent state-of-the-art nucleus/cell segmentation approaches on different types of microscopy images including bright-field, phase-contrast, differential interference contrast, fluorescence, and electron microscopies. In addition, we discuss the challenges for the current methods and the potential future work of nucleus/cell detection and segmentation.
Supervised U-Net for Pixel-Wise Liver and Tumor Segmentation
”Convolutional neural network (CNN) has been widely used for image processing tasks. In this paper we design a bottleneck supervised U-Net model and apply it to liver and tumor segmentation. Taking an image as input, the model outputs segmented images of the same size, each pixel of which takes value from 1 to K where K is the number of classes to be segmented. The innovations of this paper are two-fold: first we design a novel U-Net structure which include dense block and inception block as the base U-Net; second we design a double U-Net architecture based on the base U-Net and includes an encoding U-Net and a segmentation U-Net. The encoding U-Net is first trained to encode the labels, then the encodings are used to supervise the bottleneck of the segmentation U-Net. While training the segmentation U-Net, a weighted average of dice loss(for the final output) and MSE loss(for the bottleneck) is used as the overall loss function. This approach can help retain the hidden features of input images. The model is applied to a liver tumor 3D CT scan dataset to conduct liver and tumor seg- mentation sequentially. Experimental results indicate bottleneck supervised U-Net can accomplish segmentation tasks effectively with better performance in controlling shape distortion, reducing false positive and false negative, besides accelerating convergence. Besides, this model has good generalization for further improvement.
Abdominal Multi-Organ Segmentation with Organ-Attention Networks And Statistical Fusion
”Accurate and robust segmentation of abdominal organs on CT is essential for many clinical applications such as computer-aided diagnosis and computer-aided surgery. But this task is challenging due to the weak boundaries of organs, the complexity of the background, and the variable sizes of different organs. To address these challenges, we introduce a novel framework for multi-organ segmentation by using organ-attention networks with reverse connections (OAN-RCs) which are applied to 2D views, of the 3D CT volume, and output estimates which are combined by statistical fusion exploiting structural similarity. OAN is a two-stage deep convolutional network, where deep network features from the first stage are combined with the original image, in a second stage, to reduce the complex background and enhance the discriminative information for the target organs. RCs are added to the first stage to give the lower layers semantic information thereby enabling them to adapt to the sizes of different organs. Our networks are trained on 2D views enabling us to use holistic information and allowing efficient computation. To compensate for the limited cross-sectional information of the original 3D volumetric CT, multi-sectional images are reconstructed from the three different 2D view directions. Then we combine the segmentation results from the different views using statistical fusion, with a novel term relating the structural similarity of the 2D views to the original 3D structure. To train the network and evaluate results, 13 structures were manually annotated by four human raters and confirmed by a senior expert on 236 normal cases. We tested our algorithm and computed Dice-Sorensen similarity coefficients and surface distances for evaluating our estimates of the 13 structures. Our experiments show that the proposed approach outperforms 2D- and 3D-patch based state-of-the-art methods.
