


1. Introduction
The pantograph-catenary system is one of the most important ways to supply power for running trains. Electromechanical phenomena such as arcing and wearing affect the economic efficiency and maintenance of both the rolling stock and infrastructure. As the collecting current and sliding speed increase, the strip-wire interaction becomes more critical.
Many researchers have focused on the relation between arcing and wear: Kubo[1] pointed out that accumulated discharge energy was proportional to the wear rate based on experiential research on a copper-impregnated metalized carbon strips; Bucca[2-3] divided three main contributions to strip and contact wire wear, which are mechanical contribution, current flow contribution, and electrical arcs contribution, and offered a heuristic wear model for predicting the wear rate; Chen[4] built a friction regression model by using support vector machine(SVM) relating to pressure load, sliding speed, and current density; Zhang [5-6] applied a sine wave contact force on a pure carbon strip/Cu contact wire couple, found that increasing the amplitude and frequency may increase the possibility of arc occurrence, and indicated that arc erosion dominated the wear rate. Most of this research was undertaken experimentally, and these results depend on the dynamics of the testing bed to a great extent [7]. Therefore, it is necessary to call for a widely applicable model that can easily compute electromechanical interactions of pantograph-catenary systems and explain this electromechanical phenomenon.
In this paper, a preliminary model for contact between pantograph strips and contact wire, aiming at the relation between electrical resistance and contact force, is presented. This model can be easily built according to surface scanning results and dynamic computation/detection results, and it can be widely used in analysing this electromechanical phenomenon in pantograph-catenary systems.
2. Nominal Contact Area
Table 1. Geometrical specification of contact wires in China
| Nominal cross section area [mm2] | Radius in vertical [mm] | Radius in horizon [mm] |
| 85 | 10.8 | 11.76 |
| 100 | 11.80 | 12.81 |
| 110 | 12.34 | 12.34 |
| 120 | 12.90 | 12.90 |
| 150 | 14.40 | 14.40 |
Pantograph strips are usually carbon-based. To improve current-carrying capacity, metal powder metallurgy material or metal-impregnated carbon is used in strip manufacturing. This metal composition makes the strip characteristics non-uniform, so strips used in analyses are thought to be pure carbon.
The shape of the contact wire bottom surface (working surface) becomes flat during operation. In a new condition, the contact between the strip and contact wire can be seen as a flat/circular contact, as shown in Figure 1. The nominal contact area An can be presented as
Figure 1
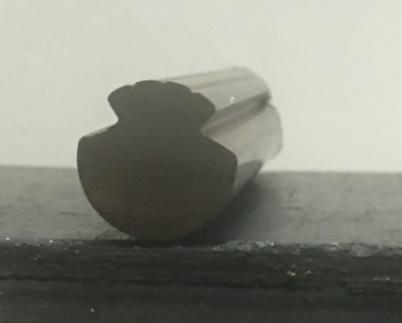
Figure 1.
A section of new contact wire on a strip
Where l is the length of the strip in the sliding direction; Fc is the contact force of the pantograph and contact lines; Kdn is the equivalent radian of the new contact wire, which can take A in Table 1; and Ce is the equivalent elasticity module, where ${{C}_{e}}={\left( 1-v_{1}^{2} \right)}/{{{e}_{1}}}\;+{\left( 1-v_{2}^{2} \right)}/{{{e}_{2}}}\;$.
In operation, the working surface of contact wires is rapidly worn and flattened. The contact becomes flat. However, if the contact area is calculated simply as a rectangle, there would be a sudden change in the contact area curve when the wear is little. Herein, the nominal contact area is defined as
Where b is the width of the contact wire wearing surface, which can be calculated as $b=\sqrt{{{R}^{2}}-wea{{r}^{2}}}$; d is the width of the elastic contact area, which can be defined as $d=0.8\sqrt[3]{p{{K}_{do}}{{C}_{e}}}$, where $p$ is the force applied to the elastic contact area; and Kdo is the equivalent radian of the worn contact wire.
3. Contact Model for Electrical Estimation
3.1. Contact Resistance
The pantograph-catenary system is a typical application of sliding electrical contact. Friction, the Joule effect, and arcing contribute to the tribological behavior complex. There are no proper parameters that can describe the progress well. However, in stationary electrical contact, electrical contact resistance is supposed to be one of the main properties. Thus, this paper tries to estimate electrical resistance as an assessment criterion in relation to the contact force applied by a pantograph to a contact wire.
As is well known, all surfaces are rough and uneven. When two surfaces contact, few parts touch. In other words, the real contact area is much smaller than the nominal one. These contact parts in elastic or elastic-plastic or plastic deformation all bear a normal force, the contact force. If there is no contamination or oxidation on the surface, the electrical current bundles together at these contact spots(a-spots) and flows from contact wire to strip. To simplify the analysis, a-spots are usually assumed to be circular. The constriction resistance Rs of one semi-infinite body can be expressed as[9]
Where $\rho $ is the electrical resistivity and $a$ is the constriction radius of an a-spot.
Differences in boundary condition make the expression slightly different[10]. The contact resistance Rc contains a pair of constriction resistance. In a pantograph-catenary system, it can be defined as
Where ${{\rho }_{s}}$ is the electrical resistivity of the pantograph strip and ${{\rho }_{c}}$ is the electrical resistivity of the contact wire.
The total contact resistance Rtc of a strip and the contact wire are the sum of all the contact resistances of a-spots on the contact surface, which are in parallel connection. Equation (4) can be rewritten as
The total contact resistance is in an inverse relationship to the sum of the radius of all a-spots. However, no exact result can be obtained from Equation (5) on the condition that the number and shape of these a-spots are uncertain and unknown.
Assume that there are two virtual planes in the strip and contact wire side respectively around the contact surface. A certain surface can be present, as Figure 2(a) shows. The interspace between the two virtual plane can be divided in a finite number of cuboid elements, $\text{d}S\times h$, as shown in Figure 2(b). Therefore, the height of asperities zc(contact wire side) and zs(strip side) are the only variables on the surface. Therefore, the strip and contact wire surface, Ss and Sc respectively, can be presented in a matrix form as
and
If $\text{d}S$ is small enough, the matrix can describe the surface well. When the sum of the asperity heights exceeds the height of the element, or
Figure 2
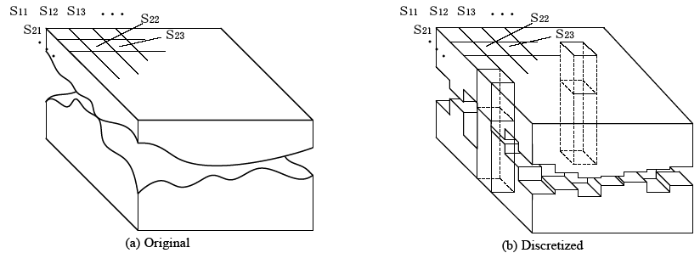
Figure 2.
Scheme of strips-contact wire contact interspace
The element is in contact. Otherwise, there is no contact in the element. The electrical resistance of the contact element can be presented as
The electrical resistance of the element without contact is $\infty $. The resistance between the two virtual planes, ${{R}_{t}}$, is
Since the resistance of the non-contact element is $\infty $, the current only goes through these contact elements. In this way, the interspace can be redrawn as Figure 3, with only the contact element left. When only considering those contact elements, Rt can be presented as
Where $\text{E}({{Z}_{S}})$ is the expectation of asperity heights in the strip side of the contact element and $\text{E}({{Z}_{C}})$ is the expectation of asperity heights in the contact wire side of the contact element.
Figure 3
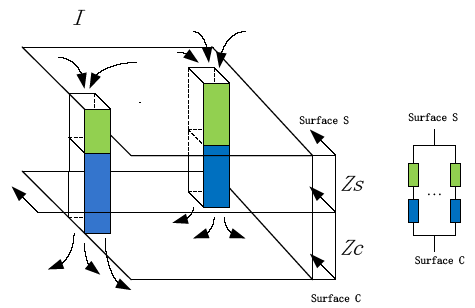
Figure 3.
Electrical model of contact interspace
Adjust the virtual planes, and let $\text{E}\left( {{Z}_{S}} \right)\text{=E}\left( {{Z}_{C}} \right)$. Equation (11) then becomes
This is the same expression as Equation (5). When $h={2\sum{\text{d}S}}/{\sum{a}}\;$, Rt in Equation (12) is equal to Rc in Equation (5). The resistance between the two virtual planes can be seen as the contact resistance of two surface. Furthermore, if there is a hypothesis that all a-spots are of equal size and independent, h can be obtainedas $1.772\sqrt{\text{d}S}$. $\text{d}S$ is small, so the interspace is a very thin layer.
Or, if a-spots are other shapes, the contact resistance can be defined as
Where ${{f}_{r}}$ is a shape factor. Therefore, h can be expressed as $1.772{{f}_{r}}\sqrt{\text{d}S}$.
3.2. Contact Force
In this paper, contact asperities are seen as cuboidal. If all asperities are in elastic deformation when the contact force is applied, the force on a single contact element is
Where $\text{d}{{F}_{\left( i,j \right)}}$ is the force applied on the element (i,j); ${{E}_{\varepsilon }}$ is the equivalent elastic module of the system, which is ${{E}_{e}}={\left( {{E}_{s}}{{E}_{c}} \right)}/{\left( {{E}_{s}}{{v}_{c}}+{{E}_{c}}{{v}_{s}} \right)}\;$; and ${{z}_{\left( i,j \right)}}$ is the height of the element (i,j).
The force on the non-contact element is 0. The contact force of the pantograph and OCL is the sum of the forces of all elements, and it can be defined as
Considering that the strips and contact wires are in different materials, the contraction on each side is equal, which is in relation as
As assumed in section 2.1, in the contact element $\text{E}({{Z}_{S}})$ is equal to $\text{E}\left( {{Z}_{C}} \right)$. The expectation of the asperity height change should be expressed as
Considering that for the elasticity module of contact wire, ${{E}_{c}}$ is much larger than the elasticity module of strips ${{E}_{s}}$, the compression on the contact wire side is dominated. However, the electrical aspect is the opposite; the resistance in the strip is remarkably outstanding, due to electrical resistivity differences.
3.3. Sliding Progress
Pantographs move with trains during operation and slide against contact wires. In stable operation, the conditions of both surfaces are in a steady state. Therefore, it can be assumed that the characteristic of surfaces such as roughness and temperature remain.
To balance strips’ wear, contact wires are arranged in a ‘Z’ shape around the center line. The zigzag involves a lateral movement for strips and contact wires, as shown in Figure 4. Usually, the stagger value is ±400mm in China high-speed railways. When the pantograph passes the support, the lateral movement reverses.
Figure 4
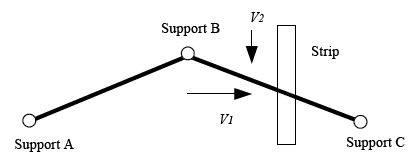
Figure 4.
Scheme of pantograph moving along contact wire
Set the longitude velocity as v1 and the lateral velocity as v2. In the v1 direction, the strip surface remains and contacts the new wire surface. The surface matrix of the contact wire Sc changes partially into a new one, as shown in Figure 5(a). The size of the conversed submatrix depends on v1, which is m×(v1/c1) (where m is the row number of the submatrix and c1 is the element length in the v1 direction). Similarly, movement in the v2 direction only occurs on the strip surface, so the matrix is transformed as shown in Figure 5(b). The size is (v2/c2)×n (where c2 is the element length in the v2 direction and n is the column number of the submatrix).
Figure 5
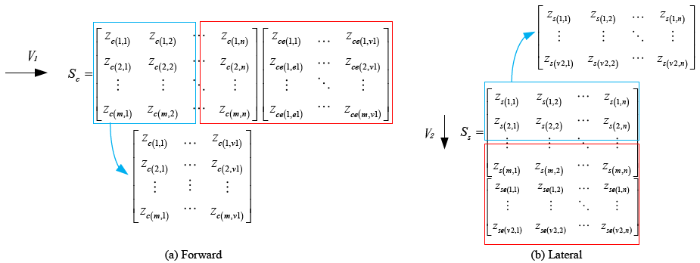
Figure 5.
Sketch of movement in matrix transforming
When the velocity increases, the size of the conversed submatrix increases. The uncertainty in the contact condition at the next moment increases as well. In this model, crashes that may happen between two moments are ignored. Hence, the sliding progress is indicated as elements in a certain area, which is decided by movement velocity, disconnecting, and connecting.
4. Computation Procedure
4.1. Overall Procedure
The procedure of computation is shown in Figure 6 and listed as follows:
Figure 6
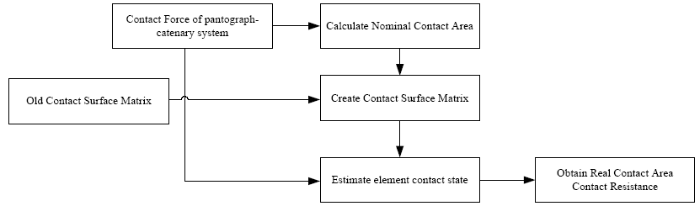
Figure 6.
Overall procedure of computation
$\cdot$ The contact force at each moment can be obtained from dynamic simulation of the pantograph-catenary system or in-situ measurement. At the same time, the position of the pantograph corresponding to zigzag should be determined.
$\cdot$ According to the wear condition of contact wires, the contact force enables us to obtain the nominal contact area between the strips and contact wires. Then, the surface matrix size can be determined by c1 and c2.The size of the surface matrix is in relation to the contact force. When the contact force changes, m and n should be recalculated. The exact surface conditions of the strips and contact wire are unlikely to be obtained; however, the surface can be generated according to Greenwood and Williamson [10], who proposed that the heights of all asperities follow the Gaussian distribution, or the Weierstrass-Mandelbrot[5] function. During computation, the partial matrix is renewed by v1 and v2.
$\cdot$ An iterative approach is used to make the right side of Equation (14) approximate to the given contact force in an acceptable error through successive refinement of height h. Therefore, the element contact condition can be obtained. Then, the real contact area and contact resistance can be obtained.
$\cdot$ Proceed to the next moment and restart from step 1.
In numerical calculation, the contact surface and time decide the precision of the results. In this model, the resolution should be the same on both surfaces, and only the shape of the section area of an element can be changed. To ease the calculation, the section area of the elements is defined as a square, where c1 is equal to c2. Considering computational capacity, c1 and c2 are suggested to be 0.1mm. Results show that the smaller the c1 and c2, the smoother the real contact area. The frequency in pantograph-catenary dynamic simulation is usually about 100Hz, and the value in dynamic measurement is 500Hz. It is preferred that there is an overlap between contact surfaces in a two time-adjacent frame, and the frequency is recommended to be as high as possible. However, when uniform surfaces are used, the result would not be remarkably different for different frequencies. Important computational parameters can be found in Appendix A.
4.2. The 3.2 a-pots Cluster
In practice, the interface between pantographs and contact wires comprises a multitude of a-spots that the electrical current passes from traction substation to locomotives. Traditionally, the number of a-spots at the pantograph-catenary interface is 3-20[4]. During operation, the number and shape of a-spots change constantly. The contact elements in this model are discrete on the surface. If adjacent contact elements can be thought of as a Holm a-spots, as shown in Figure 7, a-spots in computation can be calculated by cluster analysis.
Figure 7
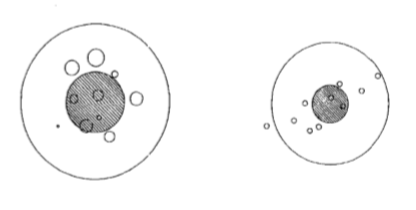
Figure 7.
Clusters of a-spots with corresponding radii of an equivalent single contact (shaded area) and Holm radius (outer radius)[10]
In this model, the contact surface is divided into an amount of rectangle area. Therefore, thedensity-based clustering algorithm could be a suitable method. Density-based spatial clustering of applications with noise(DBSCAN)[11] is used in this paper. The density and outlier radius should be defined in DBSCAN, and they refer to the minimum contact area (shaded area) and Holm radius (outer radius) respectively. In DBSCAN, points satisfying the following two conditions can be thought of as one cluster:
$\cdot$ All points within the cluster are mutually density-connected.
$\cdot$ If a point is density-reachable from any point of the cluster, it is part of the cluster as well.
The density and outlier radius in DBSCAN are largely affected by c1 and c2. However, the details of the number and spatial distribution of the a-spots are unimportant to the evaluation of contact resistance in a uniformly nominal contact area[10]. The number and cluster results can be used as auxiliary information in further analyses.
5. Results and Discussion
Numerical simulation was carried out according to the electromechanical model above. Heights of asperities on both surfaces follows Gaussian distribution. Material parameters can be found in Appendix A. In this section, influence of contact force to contact area, electrical resistance is analyzed, and some practical phenomenonare attempt to be explained.
To analyze the effect of the contact force, the repeatable procedure from Step 1 to Step 3 was performed 2000times for one level of contact force. The results are presented in Figure 8. As we can see, as the contact force increases, the nominal contact area and real contact area both increase. However, the growing rates are different, which can be easily found in the percentage of the real contact area. The real contact area increases more than the nominal contact area. Therefore, in a certain condition, increasing the contact force is an effective way to grow the real contact area between pantograph and contact wires. Figure 9 shows that wear can enlarge the nominal contact area more effectively, although increasing the rate of the nominal contact area decreases gradually as the wear grows. However, when the normal contact area reaches 90mm2 (wear = 0.2mm), the nominal contact area can no longer contribute to increasing the real contact area (Figure 10). It is worth noting that no plastic deformation of asperity summits is considered in this model, so the threshold value should be slightly higher.
Figure 8
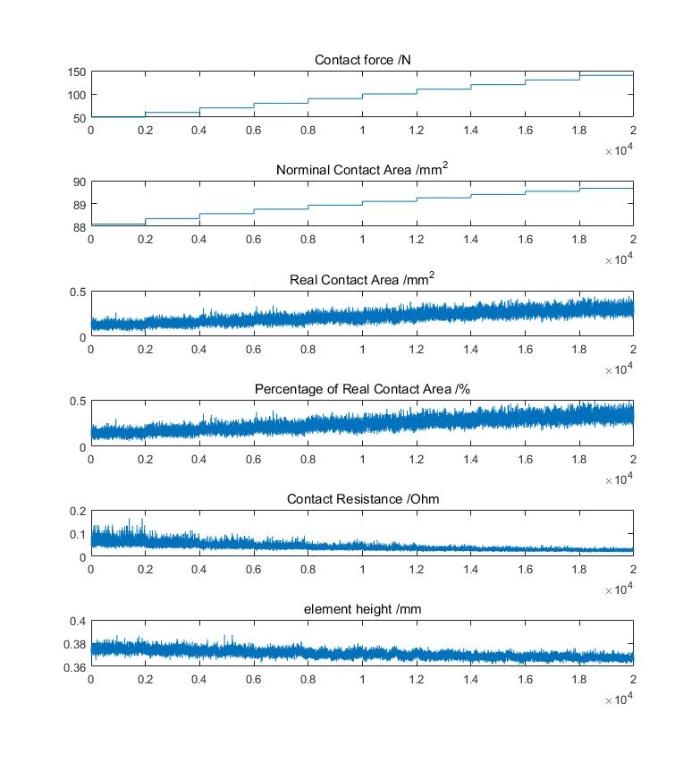
Figure 8.
Simulation result of different contact forces (wear = 0.2mm; c1= c2= 0.1mm)
Figure 9
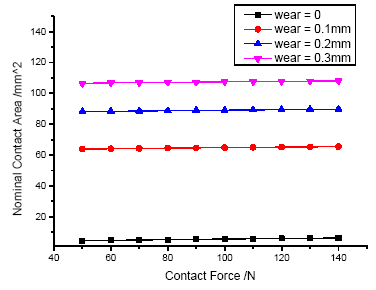
Figure 9.
Nominal contact area changes with contact force in different wear conditions
Figure 10
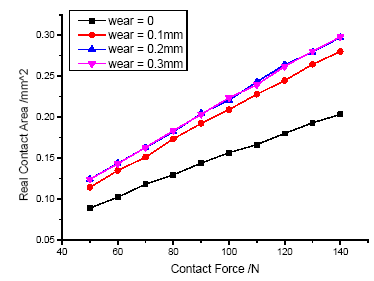
Figure 10.
Real contact area changes with contact force in different wear conditions
Furthermore, increasing the contact force can reduce the electrical resistance along with its uncertainty. The sudden increasein electrical resistance causes the real contact area to rapidly diminish, which may induce arcing under the coaction of current flow. During the transition of contact elements, vacuum arcing may be initiated because more current flows through the contact elements, causing the temperature to risethrough Joule effects and vaporizing metal in a very short time. The uncertainty of electrical resistance may be used to explain why electrical arc occurs more frequently in low contact forces.
To find the reason for arcing, let contact force Fc be a sine wave, as inreference [6]. Because the heights of elements change slightly with the contact force, there is no need to adjust element height during simulation. To ease the calculation, the slight change in element height can be thought of as a-spots’ shape altering, more specifically the change of shape factor fr. Therefore, a time-continuous simulation can be carried out without recalculating element height. Results in 1s are shown in Figure 11, where as the contact force decreases, the real contact area decreases and the contact resistance increases rapidly. Increasing the contact resistance may imply electrical performance deterioration. More heat caused by increasing resistance from the Joule effect would not accelerate the wear rate of the contact wire, because of wind cooling and the mobile contact point. However, Joule heat could affect the wear rate of strips due to the almost static contact point and high electrical resistivity. Besides, arcing that leads to material erosion should be more emphasized.
Figure 11
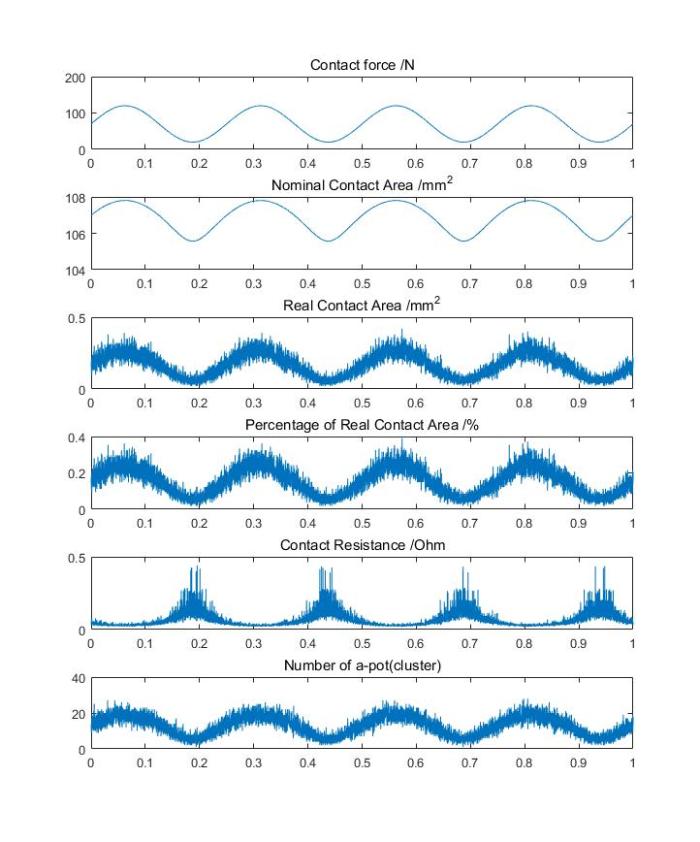
Figure 11.
Simulation result of contact force in sine wave (Fc = 70 + 50sin(8πt)N; wear = 0.2mm; c1= c2 = 0.1mm; v1 = 36km/h; v2 = 80mm/s)
Reference [12] indicates that arc occurs frequently when the contact force decreases and the sliding speed increases with contact loss. As mentioned in Section 3, no longitude behavior of the surfaces is considered. Assuming that electrical behaviors have no relation to mechanical behaviors such as crashing of asperity summits, the relative motion between the strip and the contact wire can be equal to area alternating as Figure 12. During alternating, new elements connect and old ones disconnect. At a higher forward velocity, there will be more sweeping area, and more contact elements will be disconnected. This may be an explanation for the phenomenon where the higher the speed, the more often arcing occurs. However, considering that the dynamics of pantograph-catenary systems (contact force fluctuation) play a dominating role at high speed, this explanation would be less convincing.
Figure 12
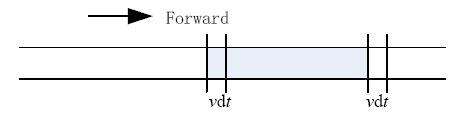
Figure 12.
Scheme of contact area altering
However, when the contact force decreases to 20, the number of a-spots is reduced to 2-7. The density and outlier radius in clustering is suggested to be 1 and 0.5mm respectively in the condition c1=c2=0.1mm, and the Holm radius of a-spots should be about 1mm based on this model. A quickly decreasing real contact area and a-spots number means that many contact elements, which can refer to electrical currents, are broken. At the same time, increasing the contact resistance makes the voltage between the two virtual planes higher. When the surface voltage and broken current reach a threshold, arcing is likely to happen. Although the threshold in sliding contact is unknown, the values for current breakers can be taken as a reference that is 12~20V and 0.25~1A respectively. Changing the rate of the contact force, which reflects to time, is believed to be another important factor in arcing; however, because this model cannot incarnate it, further research is needed.
Briefly speaking, arc may occur more frequently in two conditions: when the contact force decreases and when the contact force is low. This assumption explains the practical phenomenon that we can easily find on lines.
Based on this assumption, the desired contact force of pantograph-catenary systems should be chosen according to the nominal contact area to make sure enough elements endure the current flow during sliding with elements continuously disconnecting and connecting. If taken as a random process, the contact force needs to make a probability of sliding without arcing in a confidence intervaland minimize electrical abrasion and wear to maintain the economical operation of the pantograph-catenarysystem.
6. Conclusions
This paper present a preliminary model of electromechanical interactions of pantograph-catenary systems. In this model, electrical contact resistance and contact force are calculated in a defined contact interspace as finite cuboid elements. Elements are assumed to be uniform and elastic. The conclusions are summarized from simulation results as follows:
$\cdot$ The real contact area of the strip and contact wire could increase with the nominal contact area. However, when the nominal contact area reaches a certain value, herein 90mm2, the real contact area will no longer increase.
$\cdot$ The contact force can enlarge the real contact area and reduce the electrical contact area. The randomness of the real contact area increases when the contact force grows. On the contrary, a smaller randomness of electrical contact resistance can be found when the contact force grows.
$\cdot$ Pantograph sliding can be equivalent to contact elements disconnecting and connecting in this model. This could explain why arc occurs more frequently in two conditions: when the contact force decreases and when the contact force is low.
$\cdot$ According to clustering results, equivalent a-spots change their shape and distribution all the time. They are unimportant tocontact resistance calculations in uniform surfaces. In this model, the Holm radius of a-spots should be about 0.5mm, and the equivalent contact area is 0.01mm2.
This model can be used in the design stage when evaluating the performance of pantograph-catenary system electromechanical interactions to reduce the arcing rate and wear rate. In addition, it can be used to find the mechanism of sliding electric contacts and explain why arc occurs when there is no contact loss between the pantograph and contact wires. The velocity and plastic deformation of asperities require further research.
Acknowledgements
This paper is supported by the Technology Research and Development Project of China Railway Corporation(No. 2016J006-A) and Guangzhou Science and Technology Plan (No. 201704030048).
Appendix
The values for the strips and contact wire used in the analysis are presented in Table A1.
Table A1. Material properties
| Parameters | Value for contact wire | Value for pantograph strips |
|---|---|---|
| Elasticity Module [N/mm^2] | 119000 | 9870 |
| Poisson’s Ratio | 0.326 | 0.425 |
| Electrical Resistance [10^-8Ohm m] | 1.75 | 4000 |
| Miu [mm] | 0.145 | 0.145 |
| Sigma [mm] | 0.020 | 0.020 |
The computational values in Section 4 are listed in Table A2.
Table A2. Simulation parameters
| Parameters | Value |
|---|---|
| Radius of contact wire [mm] | 7.2 |
| Width of Strip [mm] | 25 |
| Wear of contact wire [mm] | 0/0.1/0.2/0.3 |
| Longitude length of element [mm] | 0.1 |
| Lateral length of element [mm] | 0.1 |
| Velocity in forward direction [km/h] | 36 |
| Velocity in zigzag direction [mm/s] | 80 |
| Frequency [Hz] | 10000 |
Reference
Effect of Arc Discharge on the Wear Rate and Wear Mode Transition of a Copper-Impregnated Metallized Carbon Contact Strip Sliding Against a Copper Disk
,”
DOI:10.1016/S0301-679X(99)00062-6
URL
[Cited within: 1]

Wear of the contact strip on the pantograph of electric railway vehicles is governed mainly by arc discharge occurring simultaneously with break of contact between the strip and trolley wire. As a step to clarify the wear mechanism of metallized carbon contact strips under the occurrence of contact break arc discharge, a detailed sliding wear test of 3002min duration was carried out for the combination of a copper-impregnated carbon strip and a copper disk at a sliding speed of 10002km/h. The worn surfaces of the strip and disk were observed every 502min. The voltage drop and electric current were measured throughout the test, and the occurrence and energy of the arc discharge were evaluated for each revolution of the disk. The wear process is considered in terms of the wear mode transition, and the effect of arc discharge on the mode transition and wear rate of the strip is discussed.
A Procedure for the Wear Prediction of Collector Strip and Contact Wire in Pantograph-Catenary System
,”
DOI:10.1016/j.wear.2008.05.006
URL
[Cited within: 1]

The effects of friction and electrical phenomena like arcing and sparking govern the wear rate in the sliding contact between the contact wire and the collector strip, these two effects are mutually interconnected in a complex manner. A means of investigating the wear of the collector strip and the contact wire is to carry out laboratory tests that allow to perform comparative tests between different material combinations and to establish the dependence on the main parameters such as sliding speed, contact force and current intensity. A problem to be considered in the application of the laboratory test results is their extrapolation to the real operating conditions, in order to assess the effective benefit among different solutions. In this paper, a procedure that combines a wear model for the contact between collector strip and contact wire with the simulation of the dynamic interaction between pantograph and catenary is proposed. The adopted wear model is based on the wear map concept, including the effect of electrical current flow, and it is tuned by means of the results obtained on laboratory test rig. The dependence of the electrical contact resistance on the contact force between each contact strip of the pantograph and the contact wire of the overhead line is considered and the corresponding electrical current on each of the two collectors of the pantograph is evaluated. Instantaneous values of contact forces and electrical current are then fed into the wear model and the amount of the wear of the collector strips and of the contact wire along the overhead line is calculated, generating an irregular profile of the contact wire. The proposed procedure is applied to two cases: in the first one the wear of the contact wire using copper collector strips and graphite collector strips for dc line are compared. In the second one, the consequence of the variation of the mechanical tension of the contact wire on the wear levels is predicted.
Electromechanical Interaction Between Carbon-based Pantograph Strip and Copper Contact Wire: A Heuristic Wear Model
,”
DOI:10.1016/j.triboint.2015.05.019
URL
[Cited within: 2]
61This paper presents a heuristic wear model for the contact wire.61This wear model has been tuned using the results of laboratory tests.61Wear of “electrolytic copper contact wire–Kasperovski contact strip” is analysed.61The procedure presented can be used in the design stage of catenary.
Calculation Model of Contact Resistance Between Pantograph Strip and Contact Wire in Catenary
,”
Tribological Properties of Pure Carbon Strip Affected by Dynamic Contact Force During Current-Carrying Sliding
,”
DOI:10.3390/ma11050796
URL
[Cited within: 2]
Contact force between pantograph and contact wire presents periodic variation with the running of trains. In this paper, the effects of dynamic contact force on friction coefficient and wear rate of pure carbon strip were studied on a pin-on-disk test rig with coupling and decoupling tests. Coupling results showed that the best tribological properties were obtained at 80 m/h. Decoupling results suggested that the increasing amplitude resulted in the production and extension of cracks and severe arc erosion; the increasing frequency contributed to the formation of the oxide film at low arc rate phases. This paper studied the detailed electrical wear behaviors of pure carbon strip and the related mechanism. The results may provide some practical guidance for railway operation.
Arc Discharges of a Pure Carbon Strip Affected by Dynamic Contact Force during Current-Carry Sliding
,”
DOI:10.3390/ma11050796
URL
[Cited within: 2]
Arc discharges of a pure carbon strip induced by dynamic contact force were studied on a pin-on-disk tribometer. It was found that arc discharges were produced periodically in accordance with the period of the dynamic contact force. The arcing rate of the pure carbon strip increased with an increase of frequency f and amplitude B, which led to a decrease of current-carrying quality. These influences at high velocities became much more significant. A critical point of the arcing rate at around 2% was detected. Lower than 2%, the pure carbon strip was able to maintain its excellent current-carrying capability; higher than this point, the current-carrying quality deteriorated abruptly. SEM and XPS analysis show that the element Cu detected on the worn surface at lower arcing rates was metal Cu. CuO was found at higher arcing rates. This indicated that the wear mechanism transferred from mechanical wear to arc erosion with the increase of the arcing rate.
Development of High Speed Electric-Tribometer and Researches on Tribo-electric Behaviors of Strip Materials
”
Electrical Contact Resistance: Properties of Stationary Interfaces
,”
DOI:10.1109/6144.759357
URL
[Cited within: 4]
The paper reviews the dependence of electrical constriction resistance on the shape and dimensions of /spl alpha/-spots and on the magnitude of the mechanical contact load. The range of validity of the classical voltage-temperature relation for electrical contacts is also examined. The paper describes experimental evidence of breakdown of the classical electrical contact theory when /spl alpha/-spots become too small. One of the interesting and useful properties of relatively small /spl alpha/-spots is that they are subject to large surface stresses. These stresses induce /spl alpha/-spot growth.
A Density-based Algorithm for Discovering Clusters in Large Spatial Databases with Noise
,” in
Contact of Nominally Flat Surfaces
,” in
