


1. Introduction
The cantilever beam is the main part of cantilevered low-pressure die casting machines. It bears the gravity of other structures as well as the mold filling pressure, dwell pressure, and ejection force. The failure of the cantilever beam can cause serious consequences, and it is difficult to replace or repair. Many research works have studied ways to avoid the failure of the cantilever beam[1-7]. The safety factor method was adopted in the traditional design to set the safe work limit and ensure that the mechanical parts do not fail. For large parts, the safety factor chosen by experience is not accurate. However, the safety factor, strength, and stress are all determined by the design method. Although the safety factor of some parts is greater than 1, a few parts still fail within the prescribed period of use. This is because the strength, stress, and size are random variables in the working state of the parts, and they have a certain discrete type. The reliability analysis method considers factors such as the material, load, and size of the parts as random variables and calculates the probability of structural stress greater than the allowable strength of materials by probability theory [8]. The traditional methods include the Monte Carlo method and response surface method. The response surface method is generally applied to structures with less than 20 input parameters, and the number of cycles depends on the number of input variables. The Monte Carlo method is not affected by the complexity of the structure. When analyzing the complex parts, the sample size increases and the computation increases with the increase in input variables [9-10].
Based on the reliability theory, this paper presents a hybrid stochastic finite element method to analyze the reliability of parts. Combined with the ANSYS/PDS module, firstly, the sensitivity analysis is conducted to examine the impact of inputs on the influencing factors via the Monte Carlo method. According to the analysis results, the structural parameters are optimized. Then, the response surface of the cantilever beam is fitted by the response surface method, and the reliability of the cantilever beam is calculated. This paper firstly introduces the basic theory of the reliability analysis of parts, compares the different finite element analysis methods, and briefly describes the idea of hybrid stochastic finite element simulation. The reliability of the cantilever beam is then analyzed based on ANSYS software.
2. Reliability Analysis of Mechanical Parts
2.1. Reliability Analysis Theory of Mechanical Parts
The definition of reliability is the ability of the product to complete the specified function within the specified conditions and time. The factors that affect the failure of mechanical parts can be divided into two types: strength Y and stress X. Strength refers to the ability of the material itself to resist stress. Stress is the factor that causes the failure of parts, such as force, bending moment, and torque. When $~X>Y,$ the part is considered to be failed; when $~X<Y,$ the part is reliable. In the working environment, the strength and stress of parts will be discrete due to the objective factors such as environment and external forces, which will become a random variable complying with some distributions. The stress can be expressed as $~f(x)$, and the intensity is expressedas $g(y)$. If the two are compared in the same coordinate system, the area where the cross interference occurs may fail [11-12]. The probability of failure is calculated according to the interference situation:
Where $R$ is called reliability. $~X$ and $~Y$ are two independent random variables. $~Z=Y-X,$ and the joint probability density function of $Z$ is $~f(Z)=f(X)g(Y)$. The probability that the strength $Y$ is greater than the stress $~X$ is:
Therefore, the integral region of (1) is obtained, as shown in Figure 1.
Figure 1
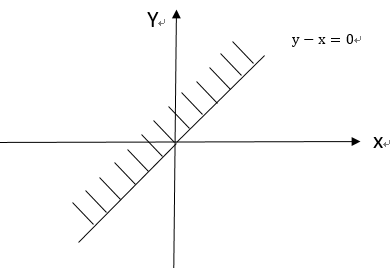
Figure 1.
Integral region of reliability
If the stress $X$ and the strength $Y$ follow the normal distribution, the mean and standard deviation are $\bar{X}$, $\bar{Y}$, and ${{\sigma }_{x}}$, ${{\sigma }_{y}}$. $Z=Y-X$ is also a random variable that complies with normal distribution; the average value is ${{\sigma }_{Z}}=\sqrt{\sigma _{X}^{2}+\sigma _{Y}^{2}}$, and the probability density function is:
The distribution diagram is shown in Figure 2. The shaded part is the failure probability of the structure, and the non-shaded part is the reliability of the structure.
Figure 2
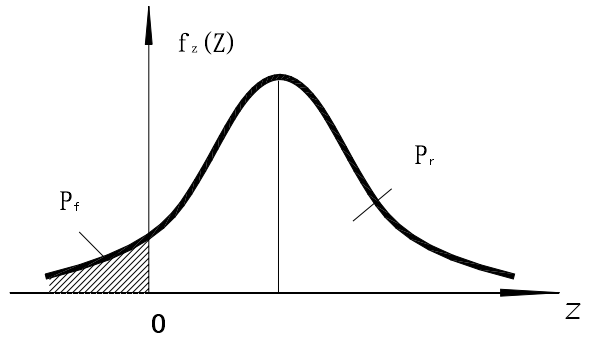
Figure 2.
Probability density function of normal distribution
2.2. Reliability Analysis of Parts based on ANSYS Platform
Probabilistic design technique is used to evaluate the influence of uncertainty of input parameters on system output behavior, and its characteristics and can be used to analyze the possibility of “failure” of parts. The input parameters include uncertain factors such as geometry size, error, material, load, etc. Response parameters include temperature, stress, displacement, etc. The PDS module of ANSYS is based on probabilistic design technique and combines finite element analysis with probabilistic design technology to evaluate the influence of random parameters on model analysis under random conditions.
The mainstep for reliability analys is of parts using the ANSYS / PDS module are as follows:
$\cdot$ Create an analysis file. The analysis process of this file includes: defining parameters, creating models, meshing, loading and solving, and post-processing. In probability design, the whole process must be applied to ANSYS parametric design language. Complex models can be modeled in other three-dimensional softwares, imported into ANSYS using the software’s data interface, and transformed into a model written in ANSYS Parametric Design Language(APDL) via the ANSYS/Workbench software.
$\cdot$ Establish a probabilistic finite element analysis database and all parameters. Enter the PDS module and specify analysis files.
$\cdot$ Define random output parameters and random output parameters.
$\cdot$ Select the tools or methods of reliability analysis. ANSYS provides three computing methods: Monte Carlo method, response surface method, and user-defined method.
$\cdot$ Perform probabilistic design analysis.If an error occurs in the loop, the loop analysis needs to be restarted. In order to improve the efficiency of computing, a small number of cycles are carried out first, and a large number of cycles can be carried out after there are no errors.
$\cdot$ The cycle ends. Carry out post-processing, such as displaying the histogram of the value distribution of random parameters, namely RP, viewing the failure probability distribution function of RP, calculating the probability when RP is less than a certain value, etc.
The data flow of the above analysis process is as follows:
Figure 3
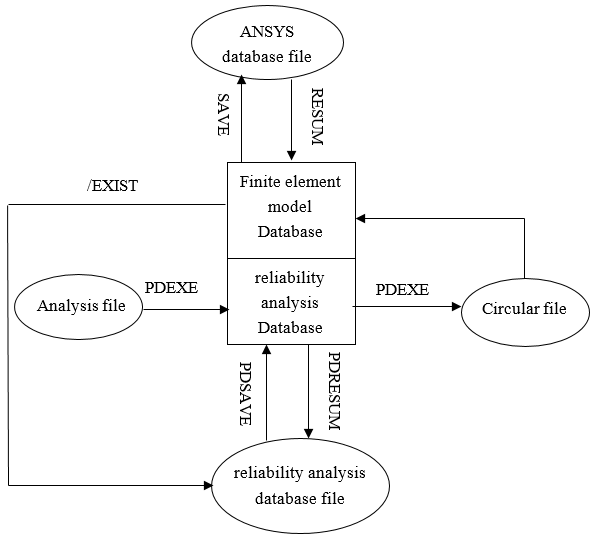
Figure 3.
PDS data flow chart
3. Stochastic Finite Element Method
The stochastic finite element method, also called the probabilistic finite element method, is an analytical method that combines the traditional finite element method with the stochastic analysis theory [13]. In the field of structural engineering, a large number of uncertain factors cause the structural size, material, and load to become variables. In the process of random finite element analysis, these variables are random variables that comply with a certain probability distribution. Based on the finite element method, the failure probability of the structure under given conditions is calculated by combining probability theory with mathematical statistics theory and strength theory.
The finite element analysis generally consists of three processes: grid division, grid analysis, and structural analysis. The factors that affect the stiffness of part structure are geometrical dimension, material parameter, and load vector. The geometrical dimension is represented by matrix $\left[ A \right]$, the material parameter is represented by matrix $\left[ B \right]$, and the load vector is represented by the matrix $~\left[ C \right]~$. The strength of the part can be expressed as: $\left[ \text{N} \right]=\int {{\left[ A \right]}^{T}}\left[ B \right]\left[ A \right]$. The stress of the part can be expressed as $\left[ F \right]=\left[ \text{N} \right]\left[ q \right]$, where $\left[ q \right]$ is the displacement of element nodes [10]. The random finite element method, which combines the Monte Carlo sampling simulation, treats the parameters that affect the parts as random variables. For convenience of calculation, the random variable can be decomposed into the sum of its mean and wave values:
When using the stochastic finite element method to calculate reliability, the Monte Carlo method and response surface method are usually combined, and they are called the Monte Carlo stochastic finite element method and the response surface stochastic finite element method.
3.1. Monte Carlo Stochastic Finite Element Method
As a common numerical simulation technique of probability analysis, the Monte Carlo method can accurately simulate the behavioral characteristics in practical situations. It is not limited by the structural state function, so it is widely used in engineering. The principle of the Monte Carlo method is a random simulation test method based on the theorem of large numbers. Through the random simulation test using limited test data and probability distribution model of data, a large number of simulation samples of test data in actual engineering are obtained. The random simulation test of random simulation experiments include direct sampling and Latin hypercube sampling.
Using the Monte Carlo simulation requires the types of the probability distribution of the random variable as well as the expectation and variance. The size of the random variables generally includes the size of the structure, modulus of elasticity, density, yield strength, equivalent force, and equivalent torque [14-15]. There are $~M$ dimensional random vectors $\mathbf{K}={{\left\{ {{K}_{1}},{{K}_{2}},{{K}_{3}},\cdots ,{{K}_{M}} \right\}}^{T}}$, each of which the probability density function of random vector is setas $f\left( {{K}_{i}} \right)$. The random number generating method is used to generate a large number of input variables of the random number ${{R}_{i}}$, and one has ${{R}_{i}}=\underset{-\infty }{\overset{{{X}_{i}}}{\mathop \int }}\,f\left( {{K}_{i}} \right)\text{d}{{K}_{i}}$. Then, the random number is sampled $~X$ times, and one can obtain $~X$ random numbers, represented by ${{R}_{1}},\text{ }{{R}_{2}}\text{, }{{R}_{3}},\cdots \text{, }{{R}_{x}}$. Then, combining Equation(3), each random number is calculated, and the $~X$ discrete variable is obtained. Finally, the probability statistics of discrete variables are calculated based on the large number theorem.
The sampling method adopts the Latin hypercube sampling method [16]. Compared with the Monte Carlo direct sampling method, the Latin hypercube sampling method can avoid the random sampling of the unity and clustering, sampling area stratified, and uniform sampling. This can reduce the sampling frequency and improve the computational efficiency under the premise of obtaining the same sampling precision. The principle is shown in Figure 4.
Figure 4
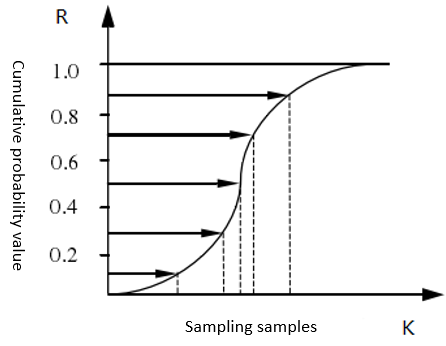
Figure 4.
Latin hypercube sampling principle
For reliability analysis of large structures, the Monte Carlo stochastic finite element method will cause a larger number of random variables. The larger the sample size, the more accurate the results, but the higher the computational cost. When the sample capacity increases, sensitivity analysis can be adopted to obtain the sensitivity coefficient of the influence of each random variable on the structural reliability. Reduce the computational cost by ignoring some random variables that have less impact.
Reliability sensitivity is the ratio of failure probability changes caused by changes in basic variable distribution parameters, expressed by partial derivatives of failure probability ${{P}_{f}}$ to random variable distribution parameters ${{\theta }_{x}}.$ The formula is $\frac{\partial {{P}_{f}}}{\partial {{\theta }_{x}}}$. Sensitivity can basically reflect the influence of random variable distribution parameters on failure probability. Thegreater the sensitivity coefficient, the greater the influence on reliability. Sensitivity includes global sensitivity and local sensitivity. The global sensitivity reflects the functional relationship between the partial derivative $\frac{\partial {{P}_{f}}}{\partial {{\theta }_{x}}}$ and the basic variable distribution parameter ${{\theta }_{x}},$ while the local variables reflect the function values of partial derivative $\frac{\partial {{P}_{f}}}{\partial {{\theta }_{x}}}$ in a given ${{\theta }_{{{x}_{i}}}}$[17]. The most commonly used sensitivity analysis method is global sensitivity. Reliability sensitivity analysis can be expressed as:
Where ${{P}_{f}}$ is the failure probability of reliability sensitivity and $\theta _{{{x}_{i}}}^{(k)}$ is the distribution parameter of random variable ${{x}_{i}}$, where ($i=1,2,3,\cdots ,n$;$k=1,2,3,\cdots ,{{m}_{i}}$, and ${{m}_{i}}$ is the total number of distribution parameters of the random variable ${{x}_{i}}$). The Monte Carlo method can be used to solve the sensitivity after transforming the above Equation [18]. Based on the ANSYS / PDS module, this article uses the Latin hypercube sampling method to analyze the sensitivity of the structure.
3.2. Response Surface Method for Random Finite Element Method
When dealing with more complex structures, the limit state functions are mostly implicit, and the functional relation between input variables and output variables is not known. The response surface method is a method based on statistical method, which reasonably selects sampling points and iterative methods and finds an approximate function between input variables and output variables to replace implicit functions [19]. For a structure, different methods of fitting may yield innumerable approximate functions. The response surface is usually expressed by a quadratic polynomial:
Where ${{\beta }_{0}},\text{ }{{\beta }_{i}},\text{ }{{\beta }_{ii}}$ are unknown coefficients to be determined by least squares. ${{x}_{1}},\text{ }{{x}_{2}},\text{ }{{x}_{3}},\cdots ,\text{ }{{x}_{i}}$ are random variables. ${Z}'$ is an approximation function, which is used instead of the implicit function $Z$, and ${g}'(x)$ is used to replace the real limit state function $g(x)$. As can be seen from Equation (4), the calculation quantity is related to the number of random variables, where $g(x)$ is affected by random parameters, including material, structural dimensions, and external loads. $g(x)=0$ is the boundary of the reliability constraint. If $~g(x)>0$, the structure is secure. If $g(x)<0$, the structure fails. Using ${{f}_{x}}(x)$ to represent the joint probability density of random variables, the probability of structural failure can be approximated as:
By Equation(5), the reliability is $R=1-P$.
The process of the response surface stochastic finite element method based on the ANSYS platform is basically the same as the Monte Carlo stochastic finite element method. However, the difference of the process is that the response surface of the structure is first fitted before Monte Carlo sampling simulation, then the fitted response surface is used to replace the finite element model of the structure for sampling simulation, and finally the simulation results are obtained. Therefore, the response surface obtained by fitting will affect the results of the next sampling simulation, which will eventually affect the sampling results. The specific flow of response surface stochastic finite element method is shown in Figure 5.
Figure 5
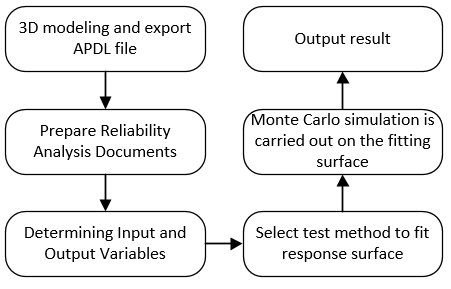
Figure 5.
Stochastic finite element analysis flow of response surface
3.3. Hybrid Stochastic Finite Element Method
The hybrid stochastic finite element analysis method combined with the sensitivity analysis method of the Monte Carlo and the response surface method can analyze the reliability of the parts. First, the Monte Carlo method is used to sample the influence parameters of the parts, and the sensitivity analysis of each parameter is obtained. Then, the parameters are optimized according to the sensitivity results. Then, the response surface method is used to analyze the optimized parameters, the response surface of the parts is obtained, and the reliability of the part is computed [20]. The reliability analysis method of the component is the same as the Monte Carlo method and the response surface method, and the analysis process is shown in Figure 6.
Figure 6
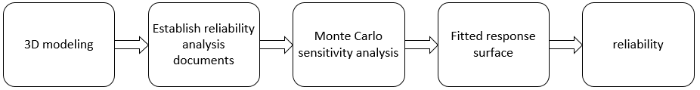
Figure 6.
Hybrid stochastic finite element analysis process of cantilever beam
4. Reliability Analysis of Cantilever Beam
4.1. Structure and Stress Analysis of Cantilever Beam
3D modeling of the cantilever beam is carried out by UG, and the 3D model is shown in Figure 7. The cantilever beam has a fixed end and a free end. The fixed end is bolted to the rotatable column and other parts are installed on the free end. A working cycle of low pressure cantilever casting machine includes casting filling, pressure forming, and stripping. During the casting filling process, the liquid alloy is pressed into the cavity by the riser when the pressure is applied. The filling pressure ${{N}_{1}}$ is about 3600kN. The filling force is transferred to the cantilever beam through the other structure, so that the cantilever beam is subjected to a vertical upward bending moment. During the solidification process of low pressure casting, the filling pressure remained stable until the liquid alloy was cooled and solidified, the pressure was unloaded, and the cantilever beam was continuously affected by the bending moment. In the drawing of the patterns process, the ejection force is about 352kN. In addition, the free end of the cantilever beam carries the gravity of other institutions, about 20kN.
Figure 7
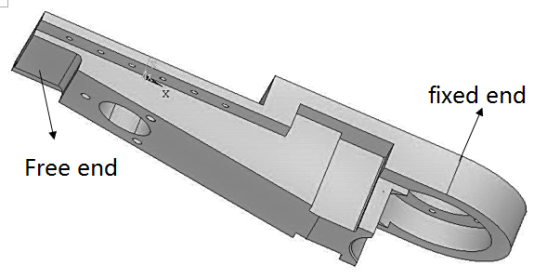
Figure 7.
The three-dimensional diagram of a cantilever beam
4.2. Reliability Analysis of Cantilever Beam
In this paper, the reliability of the cantilever beam is analyzed based on the ANSYS/PDS module. In order to improve the efficiency of the analysis, the structure of the cantilever beam is simplified, and the size parameters of the simplified structure are shown in Figure 8.
Figure 8
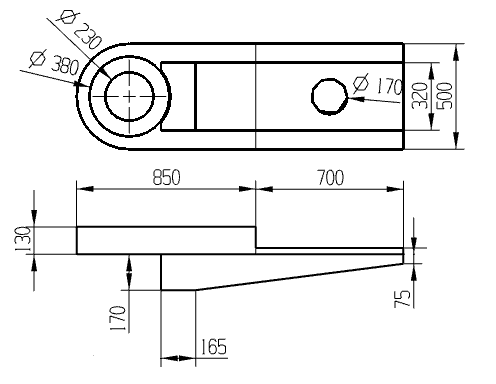
Figure 8.
Simplified two-dimensional diagram of the cantilever beam
Figure 9
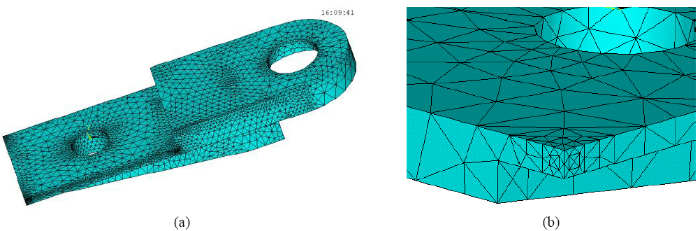
Figure 9.
(a)Schematic diagram of a cantilever beam grid; (b)Local grid thinning
Table 1. Material characteristics table
| Material | Yield point σx | Elastic Modulus E | Poisson ratio μ | Density ρ |
|---|---|---|---|---|
| Q345 | 345MPa | 206GPa | 0.28 | 0.75g/m2 |
Figure 10
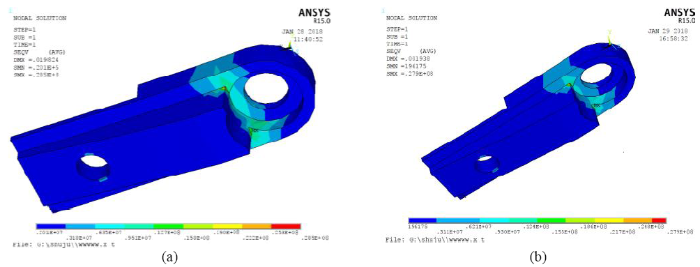
Figure 10.
(a) The stress of the cantilever beam in the filling process; (b)The stress of the cantilever beam in the drawing of patterns process
As seen from the figure above, the maximum stress appears at the fixed end of the cantilever beam. The maximum stress of the cantilever beam is 28.5MPa. The maximum stress of the cantilever beam is 27.9MPa when the die is removed. The maximum stress in both conditions is less than the yield limit of the cantilever beam, and the cantilever beam meets the working requirements. Use the above analysis to solve the save as command flow, and then input the random variables, extract the maximum stress, and set the limit state equation.
4.3. Sensitivity Analysis of Cantilever Beam
Because of the large size of the cantilever beam, only a few key structural parameters are considered, and the material and load are considered random variables. The modulus of elasticity, yield strength, and density of the material are considered random variables, and the coefficient of variation is 0.1. The Poisson ratio is located at the constant [21]. The random parameters need to be discretized by the “$3\sigma $” principle, and the input and output random variables are shown in Table 2.
Table 2. Probability distribution of random input variables
| Parameter types | Symbol | Mean | Standard deviation |
|---|---|---|---|
| Input parameters | ${{D}_{1}}$ | 230mm | 0.100 |
| ${{D}_{2}}$ | 380mm | 0.992 | |
| ${{D}_{3}}$ | 170mm | 1.014 | |
| ${{H}_{1}}$ | 500mm | 0.689 | |
| ${{H}_{2}}$ | 320mm | 0.837 | |
| ${{H}_{3}}$ | 130mm | 1.004 | |
| ${{H}_{4}}$ | 700mm | 0.787 | |
| E | 206GPa | 6.18GPa | |
| $\rho $ | $7.85\text{g/}{{\text{m}}^{\text{2}}}$ | $0.13\text{g/}{{\text{m}}^{\text{2}}}$ | |
| ${{\sigma }_{x}}$ | 345MPa | 55.62MPa | |
| ${{N}_{1}}$ | 3600kN | 1524.73N | |
| Output parameters | VMS | —— | —— |
| g(x) | —— | —— |
The above variables were input into ANSYS for the Monte Carlo sampling simulation, and the sampling method was the Latin hypercube sampling method, which was simulated 1000 times. The sample curve of g(x) is stable, indicating that the simulation sample is sufficient[22], as shown in Figure 10. The sensitivity of the variable is viewed after entering, and the sensitivity of the input variable is shown in Figure 11.
Figure 11
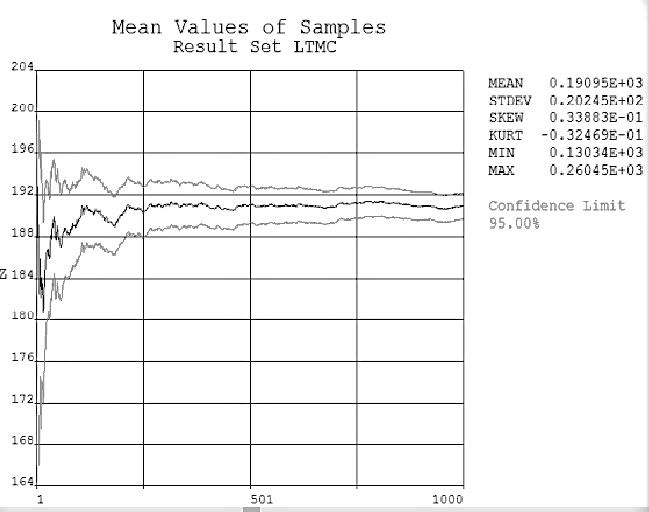
Figure 11.
Sampling process of limit state function
As seen from Figure 12, the parameters with greater influence on the limit state function are ${{\sigma }_{x}},$ $E, $ ${{H}_{1}},$ and ${{H}_{4}}.$
Figure 12
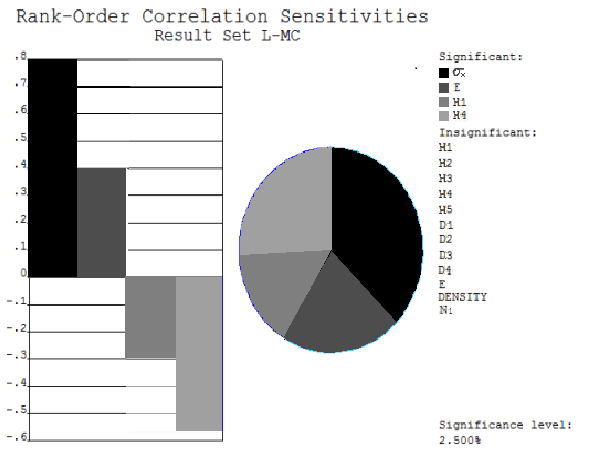
Figure 12.
Sensitivity analysis results of input parameters
The sensitivity ratio of each parameter is shown in Table 3.
Table 3. $g(x)$ Sensitivity index table
| Parameter | ${{\sigma }_{x}}$ | $E$ | ${{H}_{1}}$ | ${{H}_{4}}$ |
|---|---|---|---|---|
| Sensitivity | 0.7985 | 0.4031 | 0.2879 | 0.5746 |
| Proportion/% | 36.7 | 21.6 | 15.8 | 25.9 |
4.4. Fitting Response Surface of the Cantilever Beam
By sensitivity analysis of input variables, four input variables with high correlation are obtained. In the process of fitting the response surface with the four input variables as output, the remaining seven random variables are the input variables. Using the CCD sampling method to sample iteration, the system will determine the sampling frequency according to the input parameters. After 50 sampling simulations, the response surface of the limit state function is obtained, as shown in Figure 13.
Figure 13
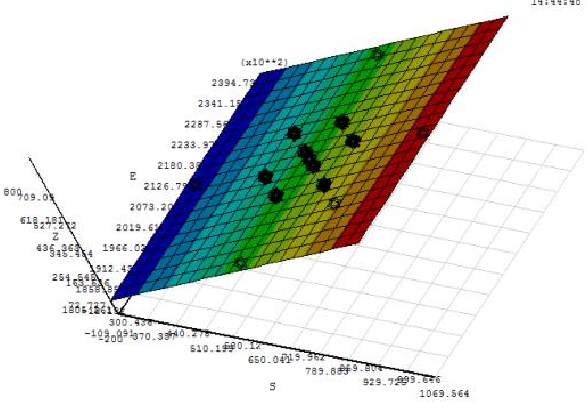
Figure 13.
Fitting response surface of cantilever beam
4.5. Reliability Analysis
The fitting response surface was simulated by 1000 Monte Carlo sampling. To check whether the sampling is convergent, the histogram of the sample ${{D}_{2}}$ is shown in Figure 14. The sample converges to the mean from the graph, indicating that the data sampling is sampled according to the given distribution, and the results are reliable.
Figure 14
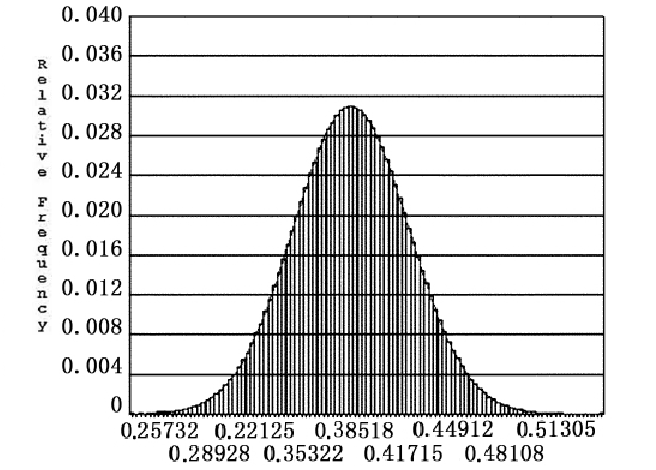
Figure 14.
Sample histogram of the structure parameter D2 of cantilever
The failure rate of the cantilever beam is obtained by sampling simulation of the fitting response surface, as shown in Figure 15.
Figure 15
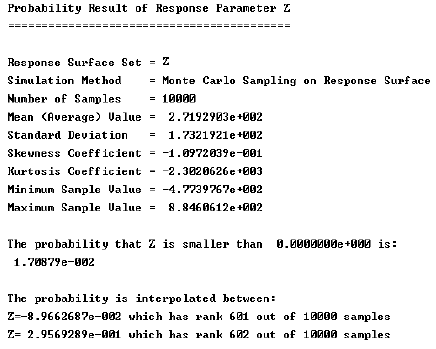
Figure 15.
Reliability analysis results of cantilever beam
As seen from Figure 15, the failure probability of the limit state function of cantilever beam is 0.0170879, while the reliability is about 0.9289.
5. Conclusions
In this paper, the reliability of the cantilever beam’s structural strength is analyzed. Based on the PDS analysis module of ANSYS, the failure probability of the cantilever beam under actual working conditionsis obtained. When the confidence level is 95%, the structural reliability is 0.9289. The sensitivity analysis of the influence parameters of the cantilever beam shows that the width of the cantilever and the length of the free end have great influence on the reliability of the structure, which provides a direction for the next structural optimization. In the structural reliability analysis, the paper combines the advantages of the Monte Carlo method and response surface method and uses a hybrid stochastic finite element method to analyze the reliability of the structure, so as to provide reference for other similar products’ reliability analysis.
Acknowledgements
This paper is supported by the Inner Mongolia Science & Technology Plan Project and the Inner Mongolia Autonomous Region Science & Technology Innovation to Guide the Reward Project (No. 102-413128).
Reference
Virtual Experiment/Analysis based on Stochastic FEM on Bearing Reliability
,”
Reliability Improvement Through Designed Experiments with Random Effects
,”
DOI:10.1016/j.cie.2017.07.027
URL

Design of experiment (DOE) is a useful tool to identify significant factors and choose factor levels for product reliability improvement. In practice, practitioners often ignore random effects that result from the experimental protocol in the reliability experiment. In this paper, we consider product reliability improvement with designed experiment when the test is actually not completely randomized. The Weibull distribution is used to model the lifetime, leading to a smallest extreme value distribution for the log-lifetime. Random effects are incorporated into the model through mean time to failure (MTTF). We improve the product reliability with maximizing the MTTF. The simulation study shows that ignoring random effects in modeling can result in unreliable factors identification and estimation. We also illustrate the proposed method with a real example.
Comparison of SOLIDWORKS and ANSYS Finite Element Analysis of Cantilever Beam Model
,”
Failure Analysis of Composite Curved Beam under Bending Load
,”
Connecting Rod Dynamic Reliability Analysis based on Stochastic Finite Element Method
,”
Reliability Modeling and Analysis of Heavy-Duty CNC Machine Tool Spindle under Hybrid Uncertainty
,”
DOI:10.1360/SSPMA2016-00522
URL
[Cited within: 1]
Heavy-duty CNC machine tools have been used to process and manufacture the products and the key components with concerns the national economy and defense security, and the quantity of heavy-duty CNC machine tools measures the industrialization level and the comprehensive strength of a country. Compared with the general machine tools, heavy-duty CNC machine tools have a more complex system structure, smaller size sample, less experimental data, incomplete information, more complex failure mechanism and other characteristics. The heavy-duty CNC machine tools as well as its sub-systems are often influenced by hybrid uncertainty and the correlated failures of different components. Therefore,the existing reliability technologies cannot be applied directly, thus new reliability technologies for specific to heavy-duty CNC machine tools are needed. Aiming at the problems analyzed above, this paper focus on the reliability modeling and analysis of heavy-duty CNC machine tool spindle under hybrid uncertainty. Firstly, this paper analyzed various uncertainty factors influencing the reliability of the heavy-duty CNC machine tool spindle and the limitations of the existing uncertainty quantification methods, constructed a unified framework for hybrid uncertainty quantification based on the imprecise probability theory. Secondly, based on the uncertainty quantification framework and stress-strength interference theory, this paper proposed an imprecise structural reliability analysis and modeling method for mechanical components. Finally, the models proposed in this paper were verified through the imprecise structural reliability analysis of a certain type of milling spindle, the imprecise structural reliability models under different failure modes are proposed.And the results are compared with the results calculated by Monte Carlo method. It has shown that the proposed method has a higher computational efficiency.
Genetic-algorithm-based Optimal Apportionment of Reliability and Redundancy Under Multiple Objectives
,”
DOI:10.1080/07408170802322994
URL
[Cited within: 1]
When solving multi-objective optimization problems subject to constraints in reliability-based design, it is desirable for the decision maker to have a sufficient number of solutions available for selection. However, many existing approaches either combine multiple objectives into a single objective or treat the objectives as penalties. This results in fewer optimal solutions than would be provided by a multi-objective approach. For such cases, a niched Pareto Genetic Algorithm (GA) may be a viable alternative. Unfortunately, it is often difficult to set penalty parameters that are required in these algorithms. In this paper, a multi-objective optimization algorithm is proposed that combines a niched Pareto GA with a constraint handling method that does not need penalty parameters. The proposed algorithm is based on Pareto tournament and equivalence sharing, and involves the following components: search for feasible solutions, selection of non-dominated solutions and maintenance of diversified solutions. It deals with multiple objectives by incorporating the concept of Pareto dominance in its selection operator while applying a niching pressure to spread the population along the Pareto frontier. To demonstrate the performance of the proposed algorithm, a test problem is presented and the solution distributions in three different generations of the algorithm are illustrated. The optimal solutions obtained with the proposed algorithm for a practical reliability problem are compared with those obtained by a single-objective optimization method, a multi-objective GA method, and a hybrid GA method.
Reliability Sensitivity Analysis of Underground Silo based on Monte-Carlo Stochastic Finite Element Method
,”Rock and soil environment, structure and material are factors affecting structure failure of underground concrete silo. A reliability sensitivity analysis model was established to study sensitivity and correlation between random parameter and performance function based on stochastic finite element method.Research showed that, silo radius was a major factor affecting strength failure of concrete silo wall, with correlation coefficient of-86.5%, which indicated that the increase of radius had adverse effects on the strength. Steel bar elastic modulus is a key factor affecting crack failure of silo wall,with correlation coefficient of 97%,which indicated that the increase of elastic modulus had positive effects on crack control. Concrete elastic modulus is a decisive factor affects flexure failure of beam and plate on concrete silo roof, with correlation coefficient of 97%, which indicated that the increase of elastic modulus was more effective in controlling deflection of beam and plate on silo roof. Concrete elastic modulus and silo radius were influential factors affecting deformation failure of concrete silo wall, with correlation coefficients of 68.7% and -67.6%respectively, which indicated that the increases of concrete elastic modulus and silo radius had positive and adverse influences on deformation control of silo wall,respectively.
The Reliability Simulation Analysis of Cantilever Beam based on ANSYS Software
,”In order to combine reliability analysis with simulation software,this paper introduces the application of reliability technology in engineering practice. By using the method of combining reliability analysis theory with ANSYS as a finite element simulation software,the three-dimensional model of a cantilever beam as the object is established and taken gridded,then boundary conditions are set and the reliability evaluation of two influence factors such as force and elastic modulus is conducted on the plat of ANSYS software's PDS module,the conclusion is the force accounts for a larger proportion of affection than the elastic modulus,with the hope of providing some help to the technology researchers in this field.
Multilevel Sequential Monte Carlo Samplers
,”
DOI:10.1016/j.spa.2016.08.004
URL
[Cited within: 1]
In this article we consider the approximation of expectations w.r.t.02probability distributions associated to the solution of partial differential equations (PDEs); this scenario appears routinely in Bayesian inverse problems. In practice, one often has to solve the associated PDE numerically, using, for instance finite element methods which depends on the step-size levelhL. In addition, the expectation cannot be computed analytically and one often resorts to Monte Carlo methods. In the context of this problem, it is known that the introduction of the multilevel Monte Carlo (MLMC) method can reduce the amount of computational effort to estimate expectations, for a given level of error. This is achieved via a telescoping identity associated to a Monte Carlo approximation of a sequence of probability distributions with discretisation levels∞>h0>h168>hL. In many practical problems of interest, one cannot achieve an i.i.d.02sampling of the associated sequence of A sequential Monte Carlo (SMC) version of the MLMC method is introduced to deal with this problem. It is shown that under appropriate assumptions, the attractive property of a reduction of the amount of computational effort to estimate expectations, for a given level of error, can be maintained within the SMC context. That is, relative to exact sampling and Monte Carlo for the distribution at the finest levelhL. The approach is numerically illustrated on a Bayesian inverse problem.
Structure/Mechanism Reliability Study
,”
Multilevel Monte Carlo for Reliability Theory
,”
DOI:10.1016/j.ress.2017.03.003
URL
[Cited within: 1]
As the size of engineered systems grows, problems in reliability theory can become computationally challenging, often due to the combinatorial growth in the number of cut sets. In this paper we demonstrate how Multilevel Monte Carlo (MLMC) — a simulation approach which is typically used for stochastic differential equation models — can be applied in reliability problems by carefully controlling the bias-variance tradeoff in approximating large system behaviour. In this first exposition of MLMC methods in reliability problems we address the canonical problem of estimating the expectation of a functional of system lifetime for non-repairable and repairable components, demonstrating the computational advantages compared to classical Monte Carlo methods. The difference in computational complexity can be orders of magnitude for very large or complicated system structures, or where the desired precision is lower.
Reliability Analysis of Structures by Iterative Improved Response Surface Method
,”
DOI:10.1016/j.strusafe.2016.02.002
URL
[Cited within: 1]
The moving least-squares method (MLSM) is a more accurate approach compare to the least-squares method (LSM) based approach in approximating implicit response of structure. The advantage of MLSM over LSM is explored to reduce the number of iterations required to obtain the updated centre point of design of experiment (DOE) to construct the final response surface for efficient reliability analysis of structures. The initial response surface is constructed based on a simplified DOE with mean values of the random variables as the centre point and updated successively to obtain the improved response surface. The reliability of structure is evaluated using this final response surface. The basis of the efficiency of the proposed method hinges on the use of simplified DOE instead of computationally involved full factorial design to achieve desired accuracy. As MLSM is more accurate compare to LSM in evaluating response surface polynomial, the centre point obtained is expected to be more accurate during iterations. Thus, the number of iteration in the update procedure will reduce and the accuracy of computed reliability will also improve. The improved performance of the proposed approach with regard to efficiency and accuracy is elucidated with the help of three numerical examples.
Imprecise Random Variables, Random Sets, and Monte Carlo Simulation
,”
DOI:10.1016/j.ijar.2016.06.012
URL
[Cited within: 1]
61Functions of an imprecise random variable defined by a family of random variables are studied.61Lower and upper probabilities are defined in two different ways and compared.61Cost saving computational methods for simulating families of random variables and random sets are presented.61Monte Carlo reweighting and polynomial chaos expansions are employed.61The results are applied to estimating the failure probability of a beam under uncertain bedding.
