


1. Introduction
Thermoplastic materials were mainly used in aerospace, automobile manufacturing, and other fields before the 21st century. It was not until 2005 when thermoplastic materials came to the fore in the wind industry. This was because blade manufacturers realized that the first batch of service blades field was about to reach their life span. The abandonment of a large number of blade materials prompted them to consider developing thermoplastic materials for recycling.
During the 2008 Composite Europe Exhibition, Henning Albers, a professor in the Department of Civil and Environmental Engineering at the University of Bremen, predicted that by 2034 the world would need to recycle about 225,000 tons of blade material per year[1]. Currently, the basic methods to deal with waste blades are landfill, burning, or filling after smashing [2]. These processes violate the environmentally friendliness principle and are contrary to the current concept of sustainable development green energy. Ramirez et al. [3] believe that finding solutions to the waste of a large number of wind turbine blades is critical to harvesting wind energy in a sustainable way. The application of thermoplastic composites is an inevitable trend in the face of the environmental damage caused by the increasingly prominent composite material waste.
When a blade reaches a certain length, the deficiency of the fiberglass performance is highlighted. Previous studies have shown that carbon fiber blades can achieve more than 30% of weight reduction from fiberglass blades [4].
Meng et al. [5] proposed an equivalent algorithm for the performance parameters of composite laminates based on the energy method. Yu et al. [6] suggested a method for CFD-CSD coupled aeroelastic analysis of HAWT blades. Bianchi et al. [7] studied the changes in air flow through the distribution of wind speed and the power of each wind speed.
This paper is organized as follows: in Section 2, the finite element method is used to calculate the mechanical properties of two-axial and three-axial laminate plates by establishing a unit model of three-dimensional equivalent volume of laminate plate as the research object. Section 3presents the loading method of distributed force after obtaining the pressure data of each chord section of the blade by using the CFD analysis method based on the design of a complete layering scheme for thermoplastic composite wind turbine blades. In Section 4, compared with the traditional MPC multi-point constrained loading method, the loading method of distributed force is shown to better simulate the mechanical characteristics of the blade.
2. Layer Design of the Thermoplastic Composite Wind Turbine Blade
In order to make the layer design more convenient, the material is defined as the following letters:
$\cdot$ Unidirectional cloth[0]2, the volume content of carbon fiber is 30%and the thickness is 1.2mm.
$\cdot$ Biaxial cloth [±45]4, the thickness is 2.4mm.
$\cdot$ Triaxial cloth [±45]4[0]2, the thickness is 1.8mm.
$\cdot$ Triaxial cloth [±45]4[90]2, the thickness is 1.8mm.
$\cdot$ Gel coating, the thickness is 0.6mm.
$\cdot$ Reinforcements [0]2, the thickness is 1.2mm.
$\cdot$ Core materials(PVC and Balsa).
In this paper, 30% carbon fiber reinforced thermoplastic composite CF/PEEK is used as plying materials for wind turbine blades. Under the condition that the mechanical properties of the single laminate are known, the 3D equivalent volume unit model was established by establishing the 2.4mm biaxial cloth and the 1.8mm triaxial cloth as shown in Figure 1, and the finite element simulation stretch and shear test was performed. The results are shown in Table 1 together with the performance parameters of other materials needed for wind turbine blades. Figure 2 describes the triaxial cloth [±45]4[0]2 tensile deformation nephogram along the 0° direction. The deformation degree is greater on the ±45° direction than on the 0° direction, which indicates that the fiber’s tensile resistance is greater on the 0° direction than on the ±45° direction. The simulated shear test also shows that the triaxial cloth greatly improves the bending and shear performance of the material.
Table 1. Performance parameters of blade materials
| Material | Elastic modulus | Shear modulus | Poisson ratio | Density |
|---|---|---|---|---|
| Unit | Gpa | Gpa | - | kg/m3 |
| A | E1=72.45 | G12=2.21 | v21=0.29 | 1440 |
| E2=7.42 | G13=2.21 | v31=0.29 | ||
| E3=7.42 | G23=2.09 | v23=0.28 | ||
| B | E1=22.83 | G12=12.80 | v21=0.62 | 1513 |
| E2=20.30 | G13=12.80 | v31=0.62 | ||
| E3=18.30 | G23=11.32 | v23=0.51 | ||
| C | E1=55.96 | G12=18.68 | v21=0.41 | 1513 |
| E2=31.48 | G13=17.29 | v31=0.41 | ||
| E3=23.95 | G23=16.54 | v23=0.35 | ||
| E | 3.44 | 1.38 | 0.3 | 1235 |
| F | 3.50 | 1.40 | 0.3 | 1100 |
| G | 0.26 | 0.02 | 0.3 | 200 |
Figure 1
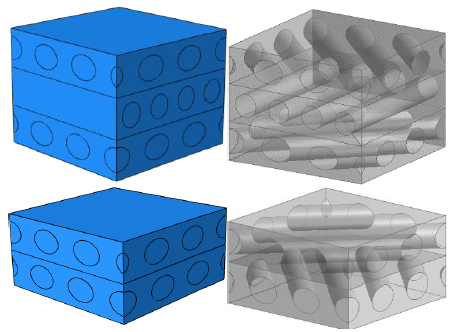
Figure 1.
Three-dimensional equivalent volume element model
Figure 2
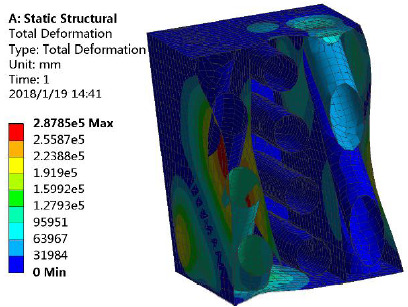
Figure 2.
Deformed cloud chart of triaxial cloth [±45]4[0]2
As shown in Figure 3, the blades are composed of the shell, spar cap, web, leading edge, trailing edge, and inserted layer. The material of layer design mainly has: 0° unidirectional cloth, ±45°biaxial cloth, [±45°/0°] triaxial cloth, PVC, balsa, unsaturated structural adhesive, etc.
Figure 3
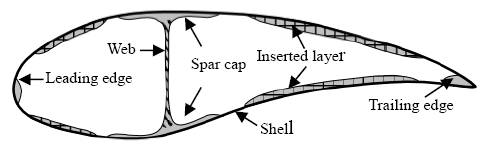
Figure 3.
Schematic diagram of wind turbine blade chord structure
2.1. Layer Design of Spar Cap
In order to avoid the collision between the blade tip and the tower frame, the spar cap should be guaranteed to have sufficient strength and rigidity. The spar cap will directly affect the first order wave natural frequency of the blade. It is necessary to avoid resonance with the excitation force. The stiffness of the spar cap is proportional to four times its absolute thickness. The intensity is proportional to the external load and is inversely proportional to the absolute thickness to the power of three [8]. Therefore, the thickness of the spar cap has great influence on stiffness and strength. Combined with the above, considering the cutting and laying of single layer fiber cloth, the spar cap should adapt the design of same width and different thickness. The distribution of the spar cap layer along the span direction is shown in Figure 4. The width of the spar cap and the staggered laying scheme is shown in Figure 5 and Figure 6 respectively.
Figure 4
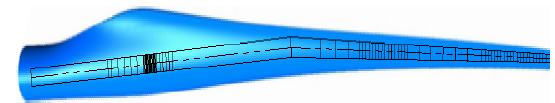
Figure 4.
The layer distribution of the spar cap along the spreading direction
Figure 5
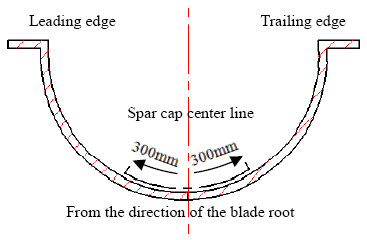
Figure 5.
The laying scheme of the spar cap width
Figure 6
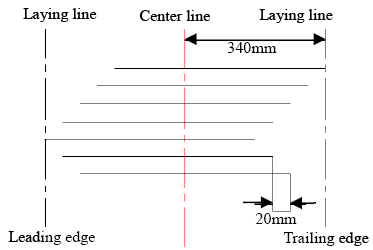
Figure 6.
Staggered laying scheme of the spar cap
2.2. Layer Design of Web
The web supports the structure of the spar cap, and the shear force is transmitted from the blade tip to the blade root. Because of the sandwich structure, the strength of buckling analysis should be satisfied. In order to ensure that the webs have enough stiffness and a certain flexibility, the inner and outer biaxial layers of the webs need to be processed as cross layers at the margin, as shown in Figure 7. The thickness of the sandwich is decreasing along the span direction. In order to ensure that the core material meets the requirements of strength and anti-buckling, the number of layers of biaxial cloth is gradually increased first, reaching the peak in the range 20%~32% of r/R, and then decreases gradually to the blade tip.
Figure 7
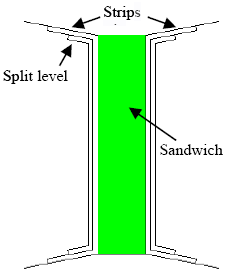
Figure 7.
Symmetrical structure layers scheme design of the web and sandwich
2.3. Layer Design of Shell
The shell is mainly for bearing the shear force from the blades and the impact of the outside flying sand, hail, and blizzard. Therefore, it is necessary to design it with a certain layer thickness. It is advisable to use biaxial cloth or triaxial cloth to cover the entire blade surface. Reasonable shell layer design is the basis of the optimal aerodynamic shape of the blade, and it is not allowed to have defects such as creases, folds, or gum deposits. The layer design of the shell is shown in Figure 8, and the fiber cloth will exceed the edge line of the mold by 120mm both at the leading edge and trailing edge.
Figure 8
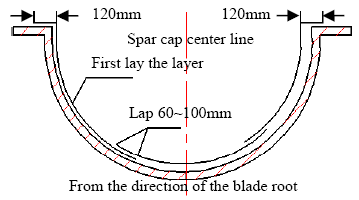
Figure 8.
The overlap layers designed schemes of the shell
2.4. Layer Design of Sandwich Structure
Reasonable sandwich structure design is the key factor to ensure the light weight of blade structure. The sandwich structure has variable sections, and the chord-wise thickness variation is much more critical than the span-wise mutation, so a chamfer design is required. The design of the sandwich structure of the blade mainly determines the thickness and the laying range of the core material to meet the overall strength and anti-buckling requirements of the blade. The selected core materials should have certain shear properties and compressive properties. The most current ones are balsa wood and PVC foam. Balsa wood after adhesion has high density and cannot be used for the laying of the whole sandwich structure. It is mainly used in the core section of the blade root to the maximum chord length section, and the remaining sandwich structures adopt foam. Figure 9 shows the laying scheme of the blade core material. Since the centroid and rigid heart of the blade are close to the leading edge, the width and thickness of the core are larger than the leading edge.
Figure 9

Figure 9.
Laying schemes of core material
2.5. Layer Design of Leading Edge Spars
The leading edge is the key part to produce aerodynamic lift. Not only do the requirements of rigidity and strength need to be satisfied, but the smooth transition designs requirements also must be ensured. The layer adopts one-way belt design, and the leeward side and windward side are respectively hand pasted and structurally adhered. The concrete leading edge spars are designed as shown in Figure 10 [9].
Figure 10
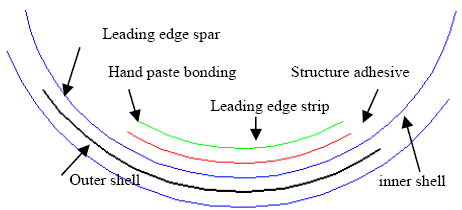
Figure 10.
Laying schemes of leading edge spars
2.6. Layer Design of Trailing Edge Spars
Similar to the leading edge spar, the trailing edge spar also bears the bending moment of the swing direction. The trailing edge spar adopts unidirectional layer design. The design objective is to determine the width and thickness of the unidirectional cloth, distribution location, and cross layer ways. The optimal design of the trailing edge layer should ensure that the structure meets the requirements of stiffness and aerodynamic stability. Figure 11 shows the thickness distribution of the s-shaped cross layer on the trailing edge, and the design scheme range of trailing edge spars along the spread are shown in Figure 12.
Figure 11
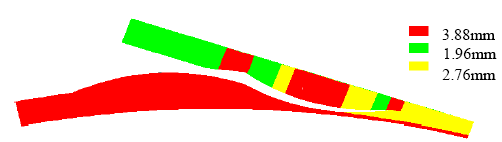
Figure 11.
The thickness distribution of s-shaped cross layer on the trailing edge
Figure 12
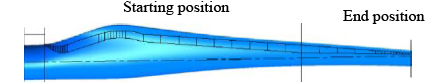
Figure 12.
Design scheme range of trailing edge spars along the spread
2.7. Layer Design of Blade Root Reinforcement Layer
According to the stress characteristics of the blade root, the layer design of the blade root reinforcement layer should adopt the three-axis direction cloth. Due to the large number of layers and thicker thickness, laying 90° direction triaxial cloth to enhance the chord-wise strength of the blade root is required. The layer design scheme of the blade root reinforcement layer is shown in Figure 13.
Figure 13
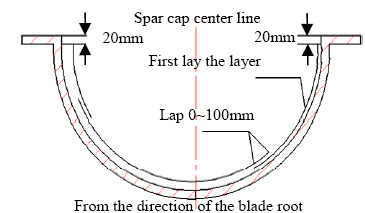
Figure 13.
Laying schemes of blade root reinforcement layer
The maximum thickness of the web was 35mm, and the leading edge and trailing edge were 30mm. The thickness gradually decreases with 1.2mm along the spreading direction.Table 2 gives the layer thickness of the 27 cross sections along the spreading blade root, leading edge, leading edge aerofoil section, spar cap, web, trailing edge aerofoil section, and trailing edge. r/R is the distance from the cross section of the airfoil to the blade root. The leading edge is closer to the spar cap, and in the case of sufficient strength, the outer shell and reinforcement layers can be retained alone in the blade tip. As the trailing edge is not directly exposed to the wind load, no reinforcement layer is laid in the layer design. The thickness distribution of the blade along the span direction to each part is shown in Figure 14.
Table 2. Properties of glass fiber composites
| Materials | E1 | E2 | Gxy | Vxy | Density |
|---|---|---|---|---|---|
| Unit | GPa | GPa | GPa | - | kg/m3 |
| A | 41.8 | 14.00 | 2.63 | 0.28 | 1920 |
| B | 13.6 | 13.3 | 11.80 | 0.51 | 1780 |
| C | 27.7 | 13.65 | 7.20 | 0.39 | 1850 |
Figure 14
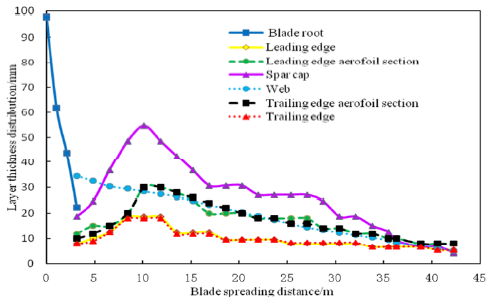
Figure 14.
The thickness distribution of the blade each part along the span direction
The structure diagram of the blade layer is shown in Figure 15. The design of the complete blade layer is shown in Figure 16. Its mass is about 5459kg. If the performance data of glass fiber reinforced epoxy resin GFRP material[10] is selected as shown in Table 2, and if it is still covered by the scheme in Table 3, it will have a mass of about 7031 kg. It can be seen from the comparison that under the same layer-layer method, the CF/PEEK composite single blade is 28.80% less than the GFRP weight, which is consistent with the conclusion of [4].
Figure 15
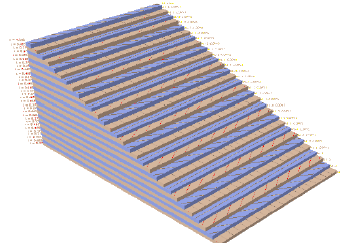
Figure 15.
The structure diagram of the blade layer
Table 3. Complete layer design scheme of blade
| r/R | Blade root | Leading edge | Leading edge aerofoilsection | Spar cap | Web | Trailing edge aerofoil section | Trailing edge |
|---|---|---|---|---|---|---|---|
| 0.000 | 1E+2B+48C+2D+2F | - | - | - | - | - | - |
| 0.025 | 1E+2B+28C+2D+2F | - | - | - | - | - | - |
| 0.050 | 1E+2B+18C+2D+2F | - | - | - | - | - | - |
| 0.075 | 1E+2B+4C+6A+2F | 1E+2B+2F | 1E+2B+1C+1A+G+2F | 1E+2B+4C+3A+2F | 6B+G | 1E+2B+1A+G+2F | 1E+2B+2F |
| 0.115 | - | 1E+2B+2A+2F | 1E+2B+1C+2A+G+2F | 1E+2B+2C+11A+2F | 6B+G | 1E+2B+1C+1A+G+2F | 1E+2B+1A+2F |
| 0.155 | - | 1E+2B+2C+1A+2F | 1E+2B+1C+2A+G+2F | 1E+2B+2C+21A+2F | 6B+G | 1E+2B+1C+2A+G+2F | 1E+2B+2C+1A+2F |
| 0.200 | - | 1E+2B+2C+6A+2F | 1E+2B+2C+2A+G+2F | 1E+2B+2C+31A+2F | 8B+G | 1E+2B+2C+2A+G+2F | 1E+2B+1C+9A |
| 0.240 | - | 1E+2B+2C+6A+2F | 1E+2B+2C+6A+G+2F | 1E+2B+2C+36A+2F | 8B+G | 1E+2B+2C+6A+G+2F | 1E+2B+1C+9A |
| 0.280 | - | 1E+2B+2C+6A+2F | 1E+2B+2C+6A+G+2F | 1E+2B+2C+31A+2F | 8B+G | 1E+2B+2C+6A+G+2F | 1E+2B+1C+9A |
| 0.320 | - | 1E+2B+2C+1A+2F | 1E+2B+2C+5A+G+2F | 1E+2B+2C+26A+2F | 8B+G | 1E+2B+2C+5A+G+2F | 1E+2B+1C+4A |
| 0.360 | - | 1E+2B+2C+1A+2F | 1E+2B+2C+4A+G+2F | 1E+2B+2C+21A+2F | 6B+G | 1E+2B+2C+4A+G+2F | 1E+2B+1C+4A |
| 0.400 | - | 1E+2B+2C+1A+2F | 1E+2B+2C+2A+G+2F | 1E+2B+2C+16A+2F | 6B+G | 1E+2B+2C+3A+G+2F | 1E+2B+1C+4A |
| 0.440 | - | 1E+2B+1A+2F | 1E+2B+2C+2A+G+2F | 1E+2B+2C+16A+2F | 6B+G | 1E+2B+2C+2A+G+2F | 1E+2B+1C+2A |
| 0.480 | - | 1E+2B+1A+2F | 1E+2B+2C+2A+G+2F | 1E+2B+2C+16A+2F | 6B+G | 1E+2B+2C+2A+G+2F | 1E+2B+1C+2A |
| 0.520 | - | 1E+2B+1A+2F | 1E+2B+2C+1A+G+2F | 1E+2B+2C+13A+2F | 6B+G | 1E+2B+2C+1A+G+2F | 1E+2B+1C+2A |
| 0.560 | - | 1E+2B+1A+2F | 1E+2B+2C+1A+G+2F | 1E+2B+2C+13A+2F | 6B+G | 1E+2B+2C+1A+G+2F | 1E+2B+1C+2A |
| 0.600 | - | 1E+2B+2F | 1E+2B+2C+1A+G+2F | 1E+2B+2C+13A+2F | 6B+G | 1E+2B+2C+1A+G+2F | 1E+2B+1C+1A |
| 0.640 | - | 1E+2B+2F | 1E+2B+2C+1A+G+2F | 1E+2B+2C+13A+2F | 6B+G | 1E+2B+2C+1A+G+2F | 1E+2B+1C+1A |
| 0.680 | - | 1E+2B+2F | 1E+2B+1C+1A+G+2F | 1E+2B+2C+11A+2F | 4B+G | 1E+2B+1C+1A+G+2F | 1E+2B+1C+1A |
| 0.720 | - | 1E+2B+2F | 1E+2B+1C+1A+G+2F | 1E+2B+2C+6A+2F | 4B+G | 1E+2B+1C+1A+G+2F | 1E+2B+1C+1A |
| 0.760 | - | 1E+2B+2F | 1E+2B+1C+1A+G+2F | 1E+2B+2C+6A+2F | 4B+G | 1E+2B+1C+1A+G+2F | 1E+2B+1C+1A |
| 0.800 | - | 1E+1B+1A+2F | 1E+2B+1C+1A+G+2F | 1E+2B+2C+3A+2F | 4B+G | 1E+2B+1C+1A+G+2F | 1E+2B+1A |
| 0.840 | - | 1E+1B+1A+2F | 1E+2B+1A+G+2F | 1E+2B+2C+1A+2F | 4B+G | 1E+2B+1A+G+2F | 1E+2B+1A |
| 0.860 | - | 1E+1B+1A+2F | 1E+2B+1A+G+2F | 1E+2B+1A+2F | 2B+G | 1E+2B+1A+G+2F | 1E+2B+1A |
| 0.920 | - | 1E+1B+1A+2F | 1E+2B+2F | 1E+3A+2F | 2B+G | 1E+2B+2F | 1E+2B+1A |
| 0.960 | - | 1E+1B+2F | 1E+2B+2F | 1E+3A+2F | 2B+G | 1E+2B+2F | 1E+2B |
| 1.000 | - | 1E+1B+2F | 1E+2B+2F | 1E+1A+2F | 2B+G | 1E+2B+2F | 1E+2B |
Figure 16
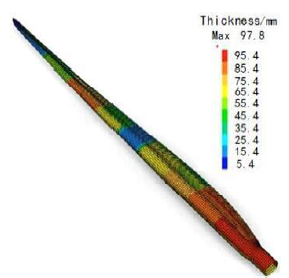
Figure 16.
The design of the complete blade layer
3. Fluid-Solid Coupling Analysis of the Thermoplastic Composite Wind Turbine Blade
3.1. Wind Turbine Blade Load Types
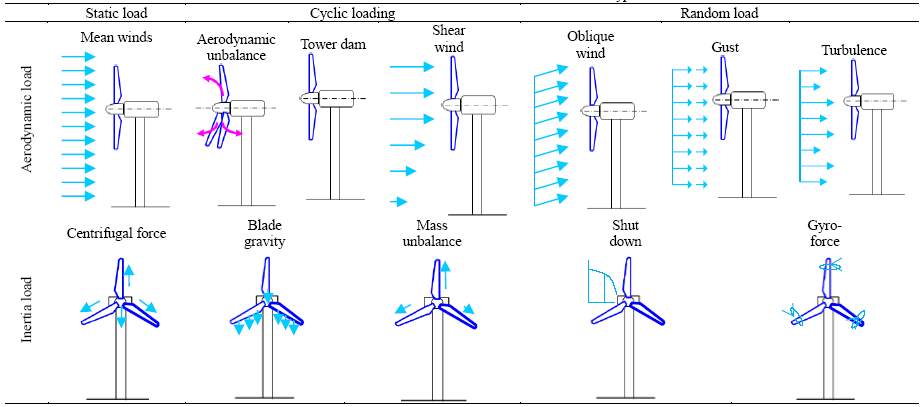
As shown in Figure 17, the force form of the blade includes the vibration bending momentMXB, the wave bending moment MYB, the wave force FXB, the vibration force FYB, the torque MZB, and the centrifugal force FZB. The load classification of wind turbine [1, 3, 11] is shown in Table 4. In most extreme load conditions, the wave bending moment is larger than the vibration bending moment of the blade. The maximum wave bending moment is near the highest part of the thickness of the blade chord-wise. Under the action of negative wave bending moment, the spar cap of the windward face is pulledand the leeward face are pressed. The maximum vibration bending moment is mainly applied near the leading edge and the trailing edge of the blade.
Figure 17
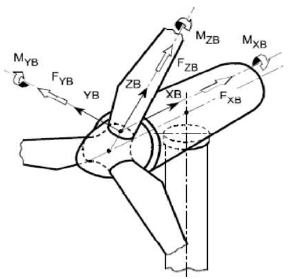
Figure 17.
Reference coordinate of load calculation
The wave bending moment causes the blade to bend outside the wind wheel, and the vibration bending moment causes the blade to bend in the wind wheel [12].
Wherer is the radius of the wind wheel, s is the radial position of the calculation point, Fn is the normal force of the airfoil section, and Ft is the tangential force of the airfoil section.
3.2. Loads Applying Method
After the layer design for the blade has been completed, it is necessary to verify the bearing performance under test load, ultimate load, and fatigue load. The operating environment of the wind turbine is very complicated. There are nearly 3000 kinds of loading conditions, and the limiting conditions of the loading of the blades should be selected for checking.
The traditional finite element analysis of wind turbine blades is mostly loaded with MPC multi point constraint, as shown in Figure 18. The aerodynamic load of the blade is applied to the surface of the blade in the form of distribution force. In order to simulate the force form of the blade more accurately, CFD simulation is used to calculate the pressure distribution value of each airfoil surface under different extreme conditions and the pressure distribution curve along the z-direction. These data can be used to check the bearing performance of the blades.
Figure 18
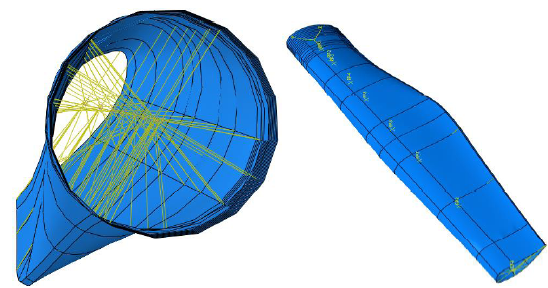
Figure 18.
Loading method of MPC coupling constraint
3.3. Fluid-Solid Coupling Analysis of Blade
The aerodynamic load value and velocity flow chart on the blade can be obtained through the analysis of the Fluid-Structure Interaction (FSI).
The density of air (15${}^{\text{ }\!\!{}^\circ\!\!\text{ }}\text{C}$) as the medium under standard conditions is 1.225kg/m3, and the viscosity is 1.7894×10⁻⁵Pa·s. By simulating the air flow around a single blade, the results can be extrapolated to the other two blades to obtain the pressure contour map of the overall blade.
The motion of the fluid follows the law of conservation of mass, the law of conservation of momentum, and the law of conservation of energy. The continuity equation is the mathematical expression of the law of mass conservation in motion fluid. The continuity equation is the kinematics equation, which is independent of the force, so it applies to the ideal fluid as well as the viscous fluid. Navier-stokes equations are equations describing the momentum conservation of viscous incompressible fluid. Both of these equations are derived by referencing the rotation state, so the simulation can be calculated without moving the grid.
Law of conservation of mass:
Represents the mass change caused by the uncertainty of a density field in the unit volume; represents the fluid mass of the volume surface of the outflow unit.
Law of conservation of momentum:
$\frac{\partial \rho }{\partial t}$ represents the mass change caused by the uncertainty of a density field in the unit volume;$\nabla \cdot \rho {{\vec{v}}_{r}}$ represents the fluid mass of the volume surface of the outflow unit.
Law of conservation of momentum:
ρis fluid density; ${{\vec{v}}_{r}}$ is relative speed; t is time; $\nabla $ is divergence, which is used to represent the intensity of divergence of each point vector field in space; $\Delta $ is the Laplacian operator; P is pressure; f is the mass force of a unit fluid; andconstant $\mu$ is the dynamic viscosity coefficient. The N-S equation generalizes the universal law of viscous incompressible flow.
Form (3), Equation (4), and $f=2\vec{\omega }\times {{\vec{v}}_{r}}$ can be obtained:
When the rated wind speed isvr=11m/s and the angular velocity $\vec{\omega }$=-2.22rad/s, the theoretical wind speed value can be obtained by numerical calculation:
With a blade length of 42.25m plus the distance from the blade root to the wind turbine hub of 1m, plug r=43.25m into Equation (6) to obtain:
The power coefficient of the wind turbine Cp is estimated by using the one-dimensional momentum theory (Baez’s Limit). 1.5MW wind turbine impeller diameter R=82.5m.
A is the sweep area of the blade, and the calculation result of the power coefficient is within the range of 59.3% of the Baez’s limit, so it is reasonable.
The equations are solved by the Reynolds mean form of continuity and momentum and the SST k-omega turbulence model. Using the periodicity assumptions shown in Figure 19, one-third of the whole domain is selected for simulation:
Figure 19
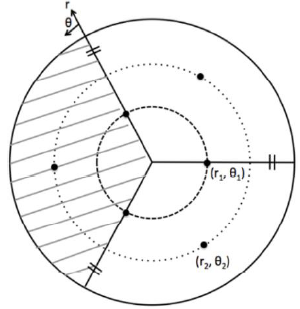
Figure 19.
Periodic boundary condition
${{\theta }_{1}}$and${{\theta }_{2}}$ represent periodic boundaries of 1/3 and 2/3 domains respectively:
Equation (11) and Equation (12) indicate that the velocity distribution is consistent with the time, and then:
The boundary conditions of the fluid domain are set as follows:
$\cdot$ Inflow velocity: vin=11m/s;
$\cdot$ Turbulence intensity: 5%;
$\cdot$ Turbulent viscosity ratio:10;
$\cdot$ Outlet: 1atm.
After importing the blade model, the volume of the blade needs to be defined, and the blade is stitched at the root to become a closed entity. Create a fluid domain as shown in Figure 20. The line distance from the blade B to the outlet point C is 90m, and the direct distance to the outlet point A is 180m.
Figure 20
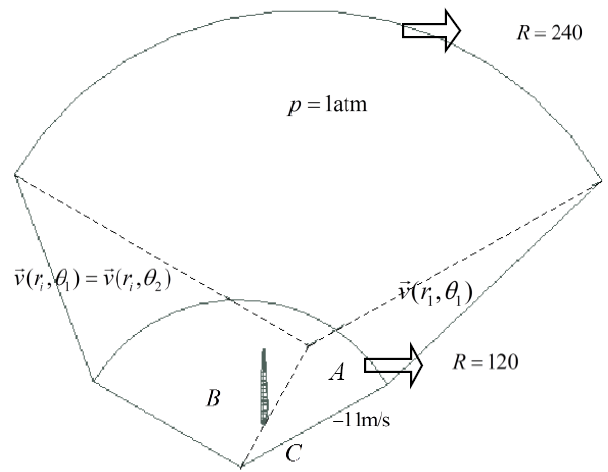
Figure 20.
Divideof fluid domain
After taking the complex shape and layer design of the blade into consideration, the division of the grid is mainly carried out on the chord-wise and span-wise directions. On the span-wise direction, the main control points of the grid division are the change points of the spar cap gradient; on the chord-wise direction, the main control points of the grid are the changes of blade layer and some key parts of the web. Figure 21 shows the grid division of the fluid domain.
Figure 21
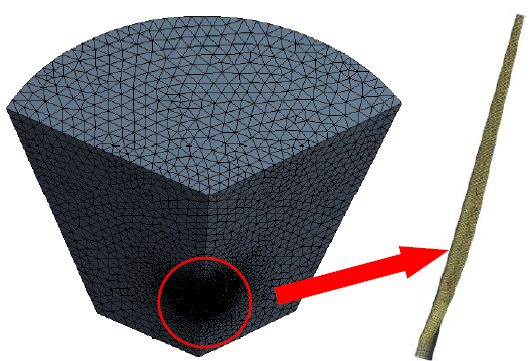
Figure 21.
Meshing divide of fluid domain
The velocity and pressure nephogram can be obtained by the solid coupling analysis of the three blades. Figure 22 shows the velocity flow diagram around the blade. The maximum velocity of the blade tip is 98.14m/s, which is consistent with the calculation result of Equation (7) for 96.02m/s, indicating that the established CFD model is correct. The surface pressure distribution of the blade’s windward and leeward surfacesare shown in Figure 23. The pressure at the leading edge is the largest. The maximum pressure value is 2.8×10³Pa, which also proves that the leading edge is the key part to obtain lift. By using these pressure data, the finite element linear static analysis can be used to obtain the stress characteristics at the root of the most dangerous part. The maximum chord length plane pressure contour is shown in Figure 24.
Figure 22
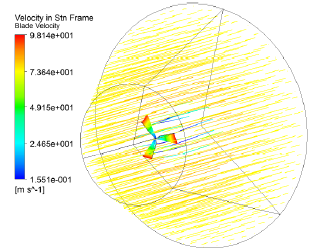
Figure 22.
Velocity flow diagram around the blade
Figure 23
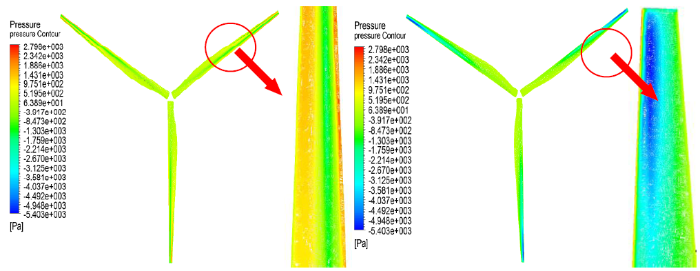
Figure 23.
The surface pressure distribution of blades windward and leeward surface
Figure 24
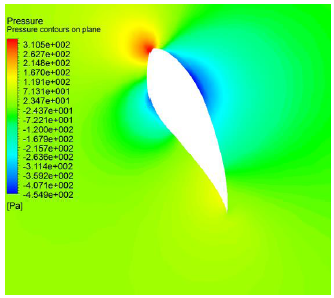
Figure 24.
The maximum chord length plane pressure contour
The maximum pressure value at the tip leading edge is nine times the maximum pressure value of the airfoil leading edge, indicating that it is particularly important to design a layer scheme at the front edge of the blade tip. Figure 25 shows the velocity vector on the maximum chord length plane. The maximum wind speed appears in the vicinity of the upper and lower spar caps. The wind speed is continuously reduced by wind turbine. The red line indicates the reflux phenomenon of wind speed. Figure 26 shows changes in pressure along the Z axis. The pressure increases as the airenters the area from A. The pressure plummets when passing the blade surfaces, but because of the reflux the pressure is rapidly rising, and it will gradually stabilize until it flows out of C.
Figure 25
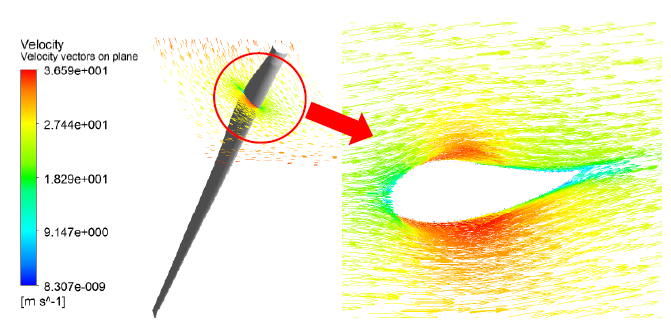
Figure 25.
The velocity vector on the maximum chord length plane
Figure 26
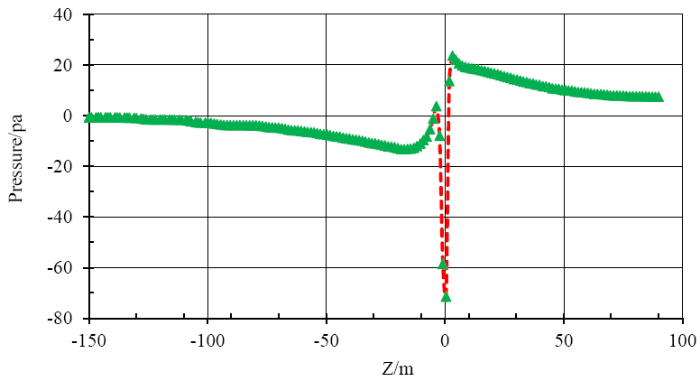
Figure 26.
Pressure changes along the Z axis
From the results of CFD post-processing, we can determine that the predicted power coefficient of the wind turbine is 38%, which matches the numerical results of Equation (8) and also shows that the CFD model has sufficient accuracy.According to the results of finite element analysis based on the distribution force loading, the force and moment at the blade root can be obtained, and the loading way of the multi-point constraint MPC is compared with the results of force and torque at the output root of GH Blade software, respectively. The error result of Table 5 shows that the error of both loading methods from the output of GH Blade software is less than 5%. The results of the distributed force loading method are closer to the results of GH Blade software and are consistent with the conclusion of [13].
Table 5. Error comparison between two loading methods with the force and torque results in the root of GH blade
| Loading mode | FXB/kN | FYB/kN | FZB/kN | MXB/(N·m) | MYB/(N·m) | MZB/(N·m) |
|---|---|---|---|---|---|---|
| Error | 4.04% | -1.54% | 0.29% | 2.07% | -2.54% | -0.82% |
| MPC | 1250.71 | -144.34 | 1580.83 | 2.42×10⁶ | 3.15×10⁵ | 6.11×10³ |
| GHBlade | 1200.21 | -146.56 | 1576.30 | 2.37×10⁶ | 3.23×10⁵ | 6.16×10³ |
| Distribution force | 1210.43 | -147.29 | 1578.10 | 2.40×10⁶ | 3.31×10⁵ | 6.15×10³ |
| Error | 0.84% | 0.50% | 0.11% | 1.25% | 2.42% | -0.16% |
4. Conclusions
In this paper, by establishing a 3D equivalent volume unit model of30% carbon fiber reinforced thermoplastic composite CF/PEEK, the performance parameters of the biaxial cloth and the triaxial cloth materials were obtained from the tensile and shear simulating tests. The overall layer design of the blade provides a certain reference value for the design of the lamination of thermoplastic composites. Under the same layering method, the CF/PEEK composite single blade weighs 28.80% less than that of GFRP. Based on the fluid-solid coupling analysis, the pressure distribution on the blade surface is obtained, and the distributed force loading method is compared with the multi-point constrained MPC loading method. The results show that the distributed force loading method can better reflect the actual stress characteristics of the blades.
Acknowledgements
This research was supported by the Research Projects of Colleges and Universities in Inner Mongolia(NJZY082), the Research Projects of Inner Mongolia Universities of Technology (ZD201502), and the National Natural Science Foundation of China (51360282).
Reference
Recycling Wind Turbine Blades
,”
Kinetics of Dissolution of Glass Fibre in Hot Alkaline Solution
,”
DOI:10.1007/s10853-017-1627-z
URL
[Cited within: 1]

Kinetics of the dissolution of E-glass fibres in alkaline solutions was investigated. To allow an accurate determination of conversion, glass fibres were immersed individually in the corrosive medium
Unsustainable Wind Turbine Blade Disposal Practices in the United States
,”DOI:10.1177/1048291116676098 URL PMID:27794074 [Cited within: 2]
Application and Development of Materials of Large-Scale Wind Turbine Blades
,”
Research and Application of Property Equivalence Algorithm for Composite Lamination Plate based on Energy Method
,”In order to simplify modeling of wind turbine blade and improve calculating efficiency,property equivalencealgorithm for composite laminate plate was put forward using strain energy method. With representative volume elementof composite as research object, based on two- dimension strain energy method, the relationship equations betweenequivalent stiffness matrix coefficient of composite property and strain energy of RVE were deduced by the threedimension strain energy method, through utilizing strain energy conservation theory and transforming different strainenergy formula. The property equivalence algorithm was applied to tri-axial composite laminate [0 , 45 ]. The calculatedresults are agreed with the measured ones. Meanwhile,the results of structural analysis of 1.5 MW blade root for layeredelement model and equivalent model are compared. The results verify the feasibility and effectiveness of the proposedalgorithm.
Predicting Wind Turbine Blade Loads and Aeroelastic Response Using a Coupled CFD-CSD Method
,”
DOI:10.1016/j.renene.2014.03.033
URL
[Cited within: 1]
61A coupled CFD–CSD method is presented for aeroelastic analyses of HAWT rotor blades.61Effects of blade deformation on the rotor blade airloads are investigated.61Blade airloads are significantly reduced by nose-down blade torsion.61Nose-down torsion also alters the unsteady blade airload behaviors.61Tower interference induces oscillatory blade deformations and vibratory loads.
Development of a Structural Optimization Strategy for the Design of Next Generation Large Thermoplastic Wind Turbine Blades
,”
DOI:10.1007/s00158-011-0722-z
URL
[Cited within: 1]
This paper presents the development of a structural optimization process for the design of future large thermoplastic wind turbine blades. The optimization process proposed in this paper consists of three optimization steps. The first step is a topology optimization of a short untwisted and non tapered section of the blade, with the inner volume used as the design domain. The second step is again a topology optimization, but on the first half of a blade to study the effect of non symmetry of the structure due to blade twist and taper. Results of this optimization step are then interpreted to build a shell model of the complete blade structure to perform composite size optimization based on a minimum mass objective subjected to constraints on deflection, composite strength and structural stability. Different blade models using ribs are then optimized and compared against conventional blade structure (box spar structure without ribs and single web structure without ribs). The use of ribs in wind turbine blade structures, which is more adapted to thermoplastic composite manufacturing than for thermoset composites, leads to slightly lighter blades than conventional blade structures.
Influence of the Constant Life Diagram Equationtion on the Fatigue Life Prediction of Composite Materials
,”
DOI:10.1016/j.ijfatigue.2009.09.008
URL
[Cited within: 1]
The influence of the constant life diagram (CLD) formulation on the fatigue life prediction of composite materials was examined. Most commonly used and recently proposed CLDs applied on composite materials fatigue data are presented and their applicability on a number of data sets is demonstrated. Composite material fatigue data from a number of well documented databases were used. The influence of the selected CLD formulation on the fatigue life prediction of composite material under spectrum loading is assessed by its ability to accurately predict unknown S–N curves for arbitrary loading. The results revealed that the simple piecewise linear formulation compares favorably to other more sophisticated and complicated schemes. For most of the cases studied, the S–N predictions based on the piecewise linear CLD are the most accurate ones.
Development Status and Trend of Large-Scale Wind Turbine Rotor Blade
,”
FEM Simulation of Distributed Force Function Loading Applied on Wind Turbine Blade
,”
